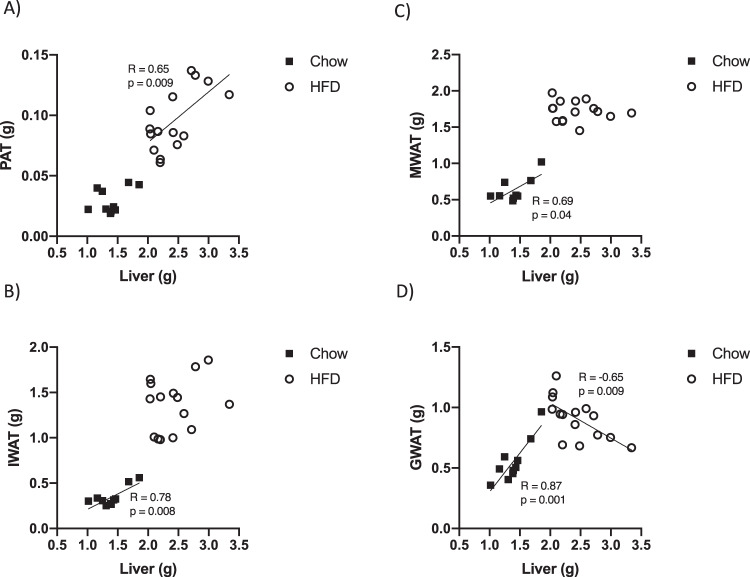
Fig. 4. Pearson correlations between different fat depots and liver weight in chow and 16-week HFD-fed male mice.
Pearson correlation was used to measure the degree of correlation between liver weight and, respectively, a PAT weight, b IWAT weight, c MWAT weight, and d GWAT weight. Black squares indicate mice fed with chow diet and white circles indicate mice fed with HFD. A p value < 0.05 indicates that the Pearson’s correlations coefficient (R) is significantly different from zero. PAT peripancreatic adipose tissue, MWAT mesenteric adipose tissue, IWAT inguinal adipose tissue, and GWAT gonadal adipose tissue.

