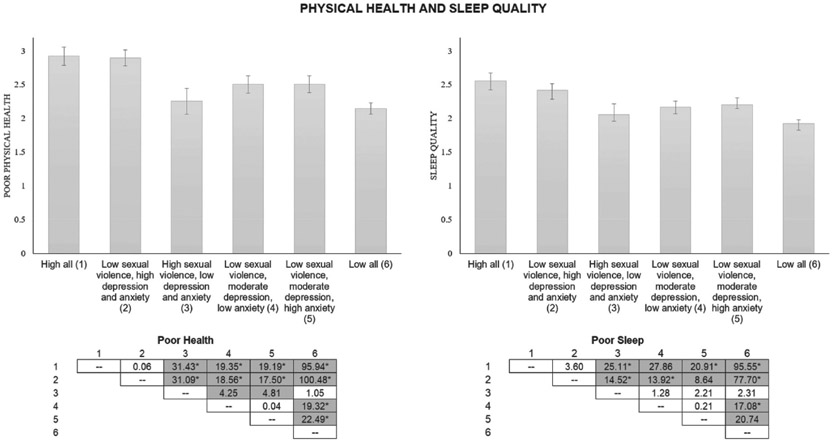
Figure 2.
Means, confidence intervals, and chi-square values by Time 1 class for the physical health domain at Time 2. Note. Figure vertical bars represent mean values on the physical health measures for each of the indicated groups. Higher scores represent worse physical health. Values in boxes indicate chi-square values between indicated groups. Shaded values are significant at p < .05. *Pairwise comparison is robust to Bonferroni correction (p = .0004).

