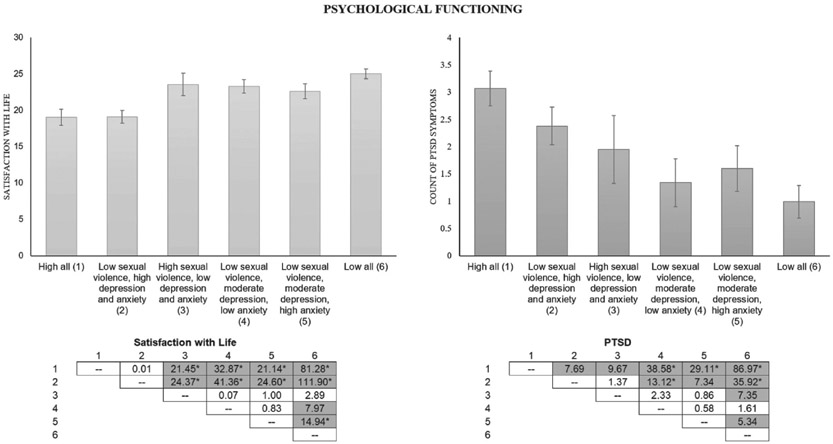
Figure 4.
Means, confidence intervals, and chi-square values by Time 1 class for the psychological functioning domain at Time 2. Note. Figure vertical bars represent mean values on the psychological functioning measures for each of the indicated groups. Higher scores on the Satisfaction with Life figure represent higher reported scores on the Satisfaction with Life Scale. Higher scores on the PTSD figure represent a greater number of reported PTSD symptoms. Values in boxes indicate chi-square values between indicated groups. Shaded values are significant at p < .05. *Pairwise comparison is robust to Bonferroni correction (p = .0004).

