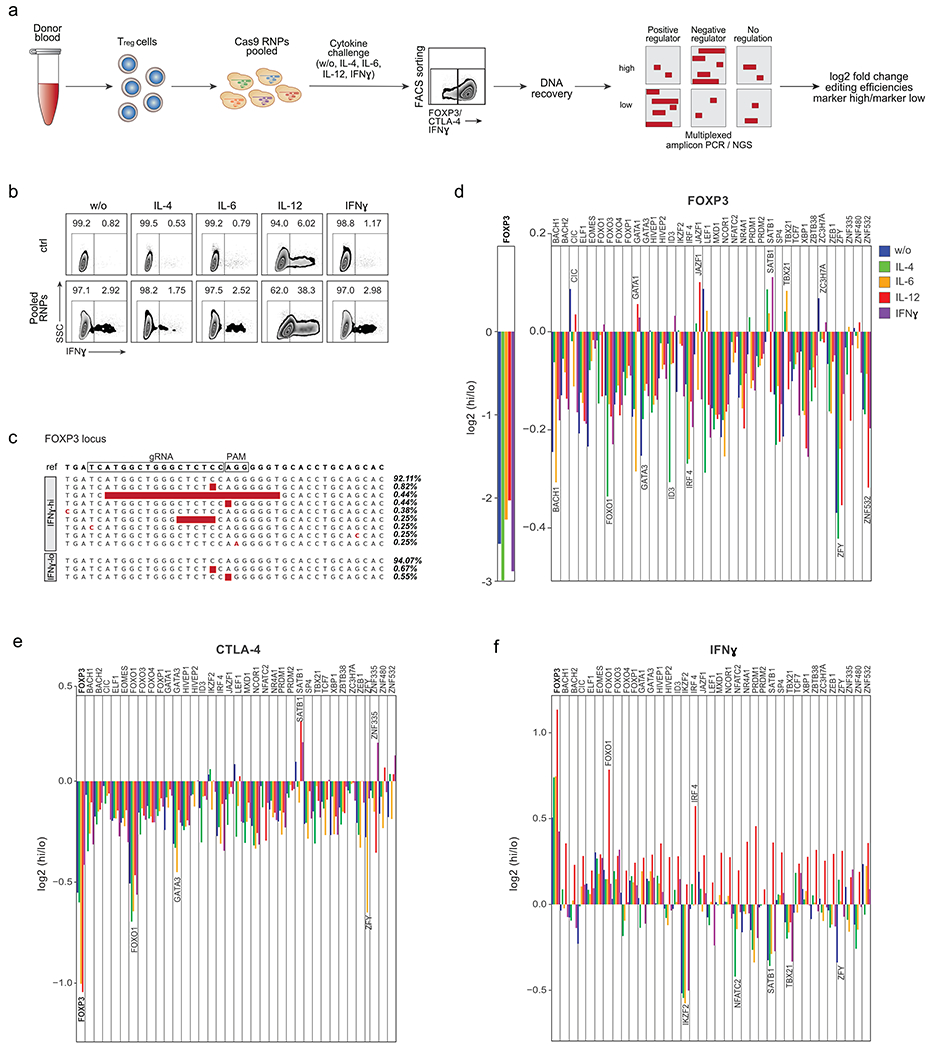
Figure 1. Pooled Cas9 RNP screens identify regulators of FOXP3, CTLA-4 and IFN-γ levels in Treg cells.

(a) Schematic workflow of pooled Cas9 RNP screens. Following cell sorting based on protein expression in varying cytokine conditions, DNA is recovered, target and control sites are amplified by multiplex PCR, and amplicons are subjected to deep sequencing. (b) FACS sorting strategy to isolate IFN-γ–high (hi) and IFN-γ-lo w (lo) Treg cells after electroporation with non-targeting control Cas9 RNP (ctrl; top) or with a pool of RNPs targeting 40 selected TFs. Ctrl and “Pool RNP” Treg cells were stimulated with IL-2 only (w/o) or IL-2 with IL-4, IL-6, IL-12 or IFN-γ. Representative example from one of 4 human blood donors (ZFY KO was assessed in only 3 human blood donors). (c) Selected examples of indels detected with multiplex PCR and deep sequencing at the targeted FOXP3 locus in FACS-sorted IFN-γ–hi and IFN-γ-lo cell populations. Read frequencies are shown on the right. (d) log2 fold enrichment of indels in FOXP3-hi vs. FOXP3-lo cell populations at the targeted FOXP3 locus (left) or at other targeted TF loci (right). (e) log2 fold enrichment of indels in CTLA-4-hi vs. CTLA-4-lo cell populations at target loci. (f) log2 fold enrichment of indels in IFN-γ–hi vs IFN-γ-lo cell populations at target loci. d-f: Mean of log2 fold enrichment in cells from 4 blood donors. Results of the ctrl regions: Extended Data Fig. 1c – e.
