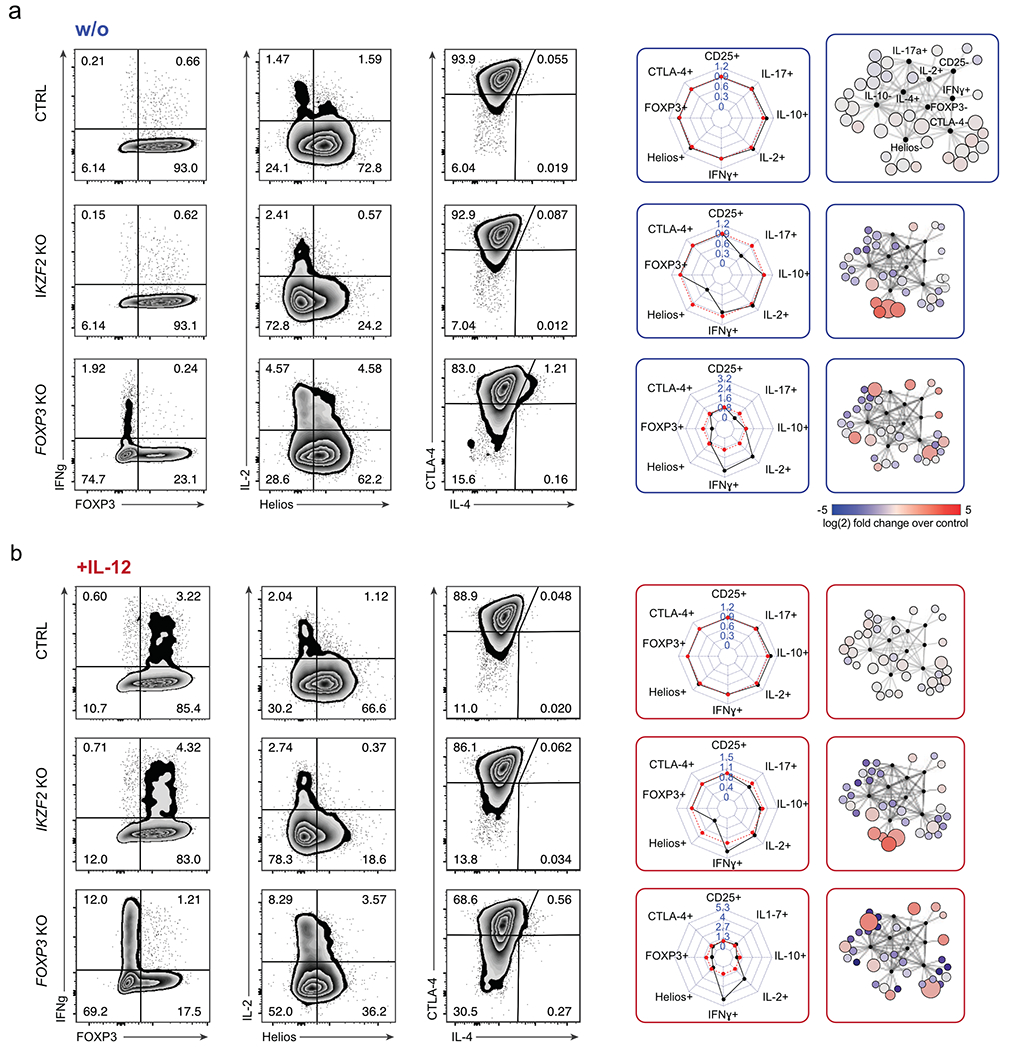
Figure 3. Deep phenotypic analysis of altered protein expression resulting from individual TF ablations.

(a) Left: Representative flow cytometry analysis of IKZF2 KO and FOXP3 KO Treg cells compared to control non-targeting RNP-treated Treg cells (ctrl) without IL-12 stimulation. Middle: Personality plots summarizing flow cytometry results for 8 markers (IL-4 was excluded from these plots due to low absolute levels that skewed fold-change analyses). Each dimension on the personality plots—representing one flow cytometry marker—indicates the ratio of the percent “marker-high” cells in TF KO population relative to the percent “marker-high” in non-targeting RNP treated Treg cells. Red lines indicate average marker positive cells in ctrl cells electroporated with non-targeting RNP (6 ctrls; 3 different non-targeting RNPs, one replicate each). For each TF KO, black lines indicate the ratio of percent positive expression of a given marker relative to the average of the associated ctrls. Right: Corresponding Scaffold plots for 9-dimensional visualization of flow cytometry data27. Landmark nodes (black) are labelled based on reference gates in ctrl samples. Size of cluster nodes indicates number of cells in the cluster. Colour scale: increase (red) or decrease (blue) in relative population frequency of given cluster. Representative results from one of two blood donors and one of three independent gRNAs. (b) Flow cytometry results and personality plots for ctrl, IKZF2 KO and FOXP3 KO Treg cells with IL-12 treatment (same Cas9 RNPs and same donor as in a). Representative result from one of two blood donors and one of three independent gRNAs.
