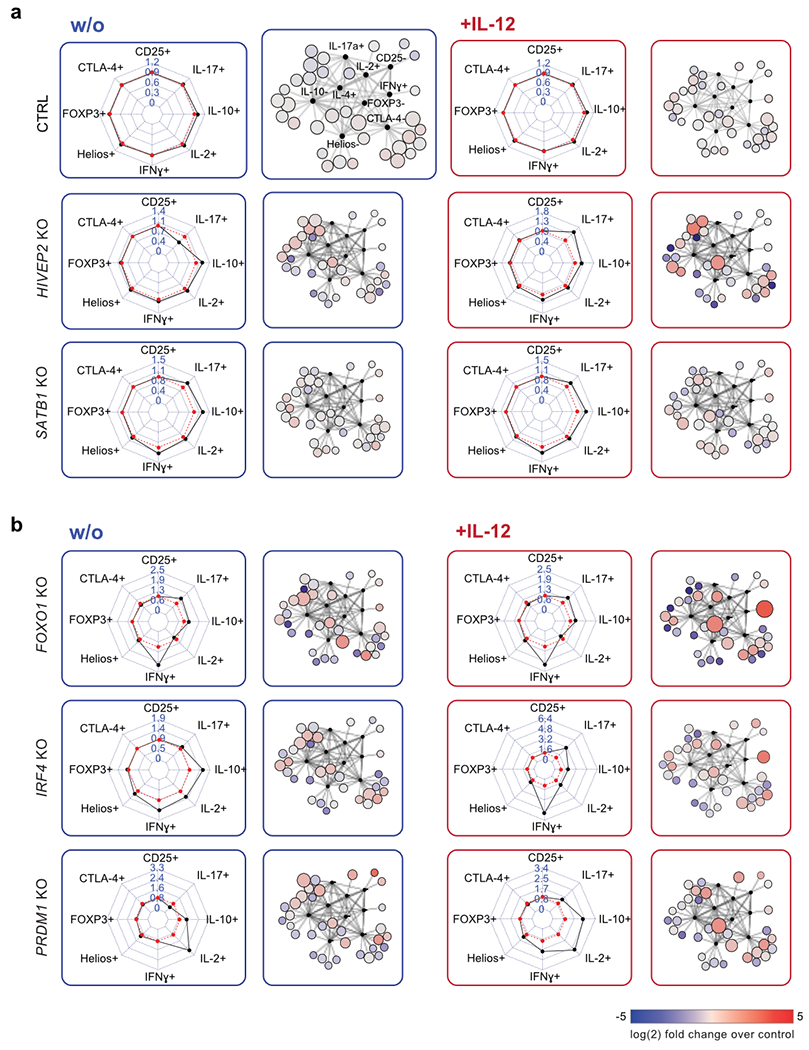
Figure 4. Multidimensional characterization of selected hits from arrayed Cas9 RNP screen.

(a) Representative personality plots and Scaffold analysis of SATB1 KO and HIVEP2 KO Treg cells compared to control non-targeting RNP treated Treg cells (ctrl) without (blue) and with IL-12 stimulation (red) (IL-4 was excluded from these plots due to low absolute levels that skewed fold-change analyses). Ctrl Treg cells are the same as shown in Fig. 3a. (b) Representative personality and Scaffold plots for FOXO1, IRF4 and PRDM1 KO Treg cells. Dysregulated cytokine production after IL-12 production is highlighted in the respective Scaffold plots. Representative results from one out of two blood donor and one of three independent gRNAs.
