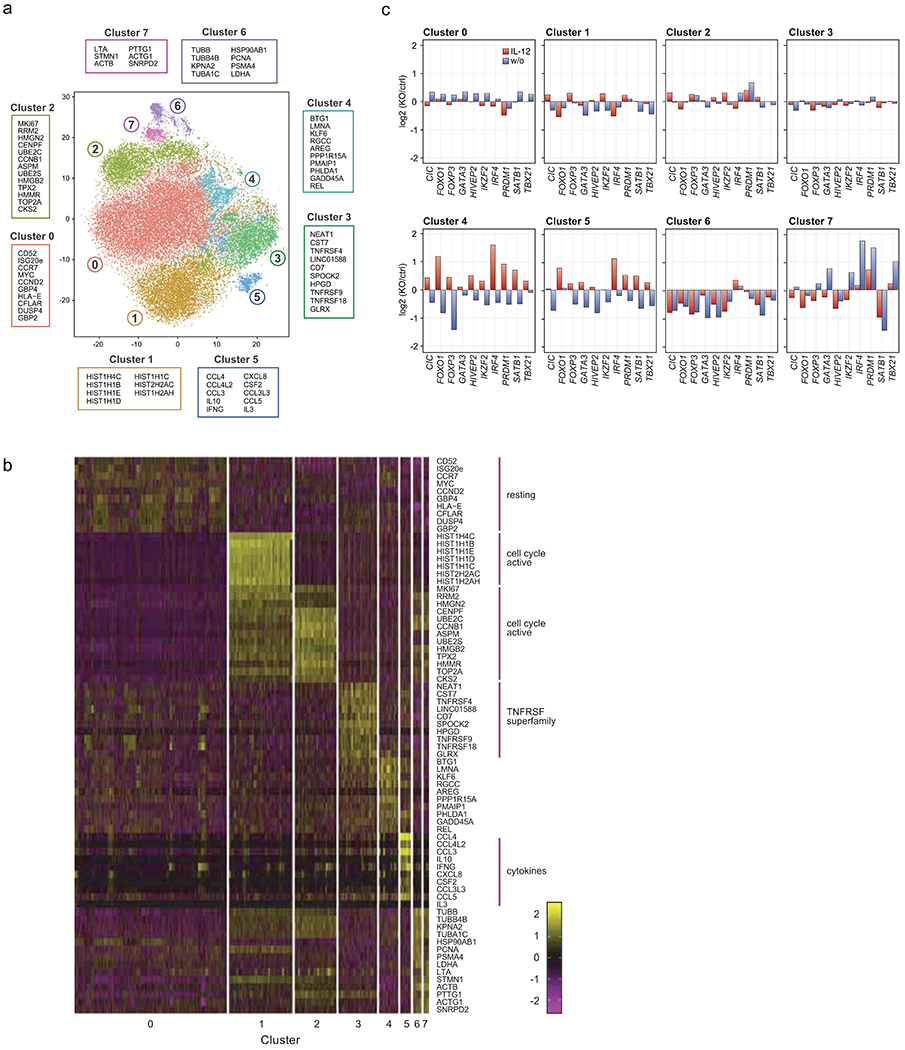
Figure 5. Distinct phenotypic landscapes in scRNA-seq of TF KO human Treg cells.

(a) t-SNE plot summarizing all cell states assessed by analysis of 10 TF KO and control Treg cells electroporated with non-targeting Cas9 RNP with and without IL-12 stimulation. 8 cell phenotype clusters (Clusters 0-7) were identified based on DE gene expression analysis of the scRNA-seq data. The 10 genes with the highest fold-change in expression levels in each individual cluster compared to all clusters are indicated. (b) Heatmap showing the individual cellular expression levels of the top 10 genes differentially expressed in each cluster versus other clusters in Fig. 5a). (c) Phenotypic distribution of cells in each cluster resulting from each TF KO w/o (blue) and with IL-12 stimulation (red) (normalized to ctrl cells in the corresponding cytokine condition). Data were generated with ex vivo expanded Treg cells from 2 human blood donors. Detailed list of all conditions: Supplementary Table 3.
