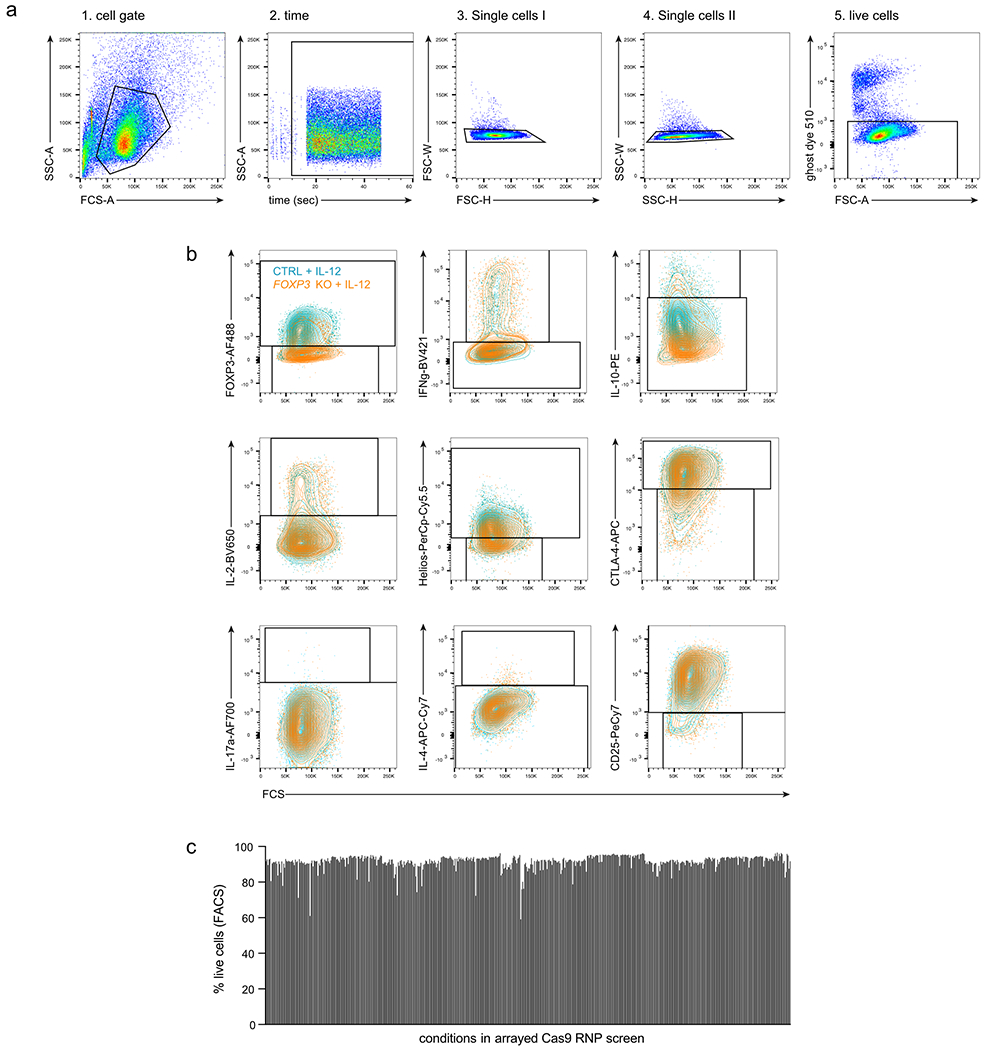
Extended Data Fig. 2. Flow cytometry gating strategy to define changes in Treg cell phenotype in arrayed Cas9 RNP screen.

(a) Initial gating strategy to identify live cells. (b) Gating strategy to assess Treg cell stability for personality and Scaffold plots. Control non-targeting Cas9 RNP-treated Treg cells (ctrl) after IL-12 conditioning are shown in light blue and FOXP3 KO Treg cells after IL-12 stimulation are shown in orange. a, b: Representative result for one non-targeting control Cas9 RNP in one out of two human blood donors. (c) % of live cells based on flow cytometry staining for all conditions tested in the arrayed Cas9 RNP screen.
