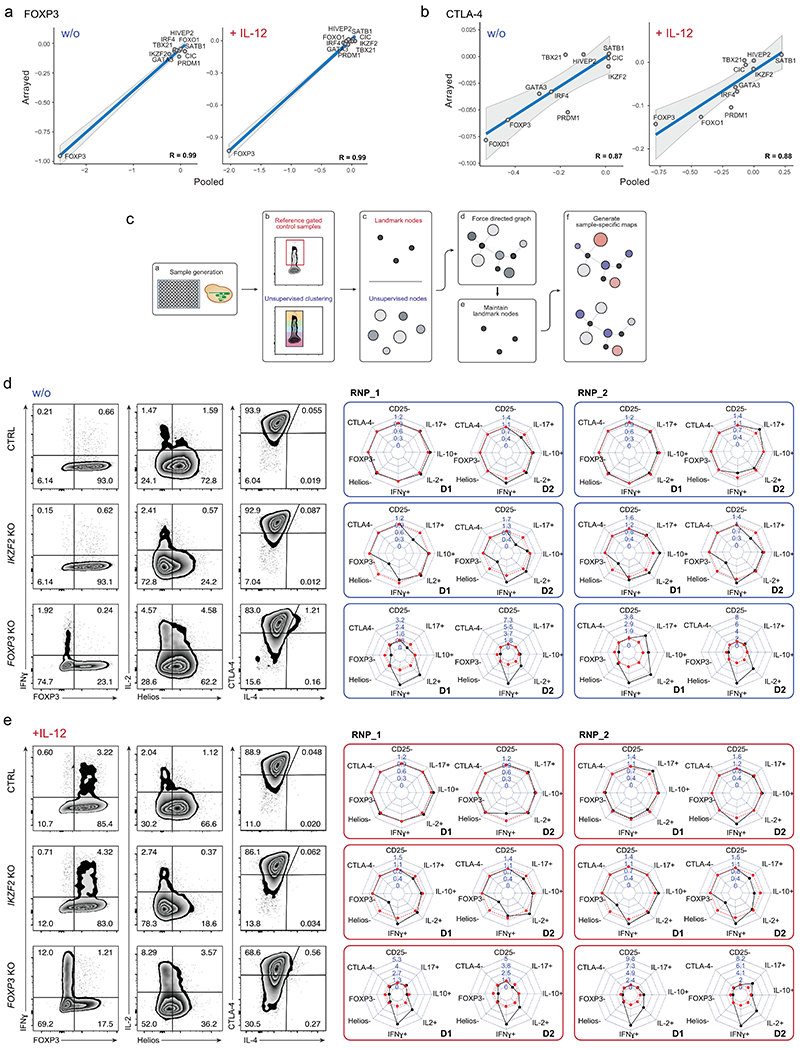
Extended Data Fig. 3. Extended analysis of arrayed Cas9 RNP screen data.

Comparison of results generated in pooled (log2(#indels in “marker high” population/#indels in “marker low” population) versus arrayed Cas9 RNP screens (log2(% “marker high” in KO/% “marker high” in ctrl)) for FOXP3 (a) and CTLA-4 expression (b) with and w/o IL-12 stimulation for 10 selected TFs with notable effects on protein levels (see Methods and Supplementary Table 4) For the pooled screen, the calculated values are based on 4 human blood donors. For the arrayed screen, the calculated values are based mean fold-change values determined from 3 independent gRNAs and 2 human blood donors. The R value is based on these data points (highlighted in the graphs). Grey shading is provided by the loess algorithm in R, which uses polynomial regression to locally fit a surface to each point. (c) Schematic workflow of Scaffold generating landmark nodes and unsupervised clustering for visualization of TF KO cell subpopulations. (d, e) Phenotypic characterization of ctrl, IKZF2 and FOXP3 KO Treg cells with two-dimensional flow cytometry and personality plots w/o (d) and with IL-12 treatment (e) in Treg cells from two human blood donors (D1 and D2) with two of three different Cas9 RNPs targeting each gene (extended version of Fig. 3). Note: IL-4 was excluded from these plots due to low absolute levels that skewed fold-change analyses.
