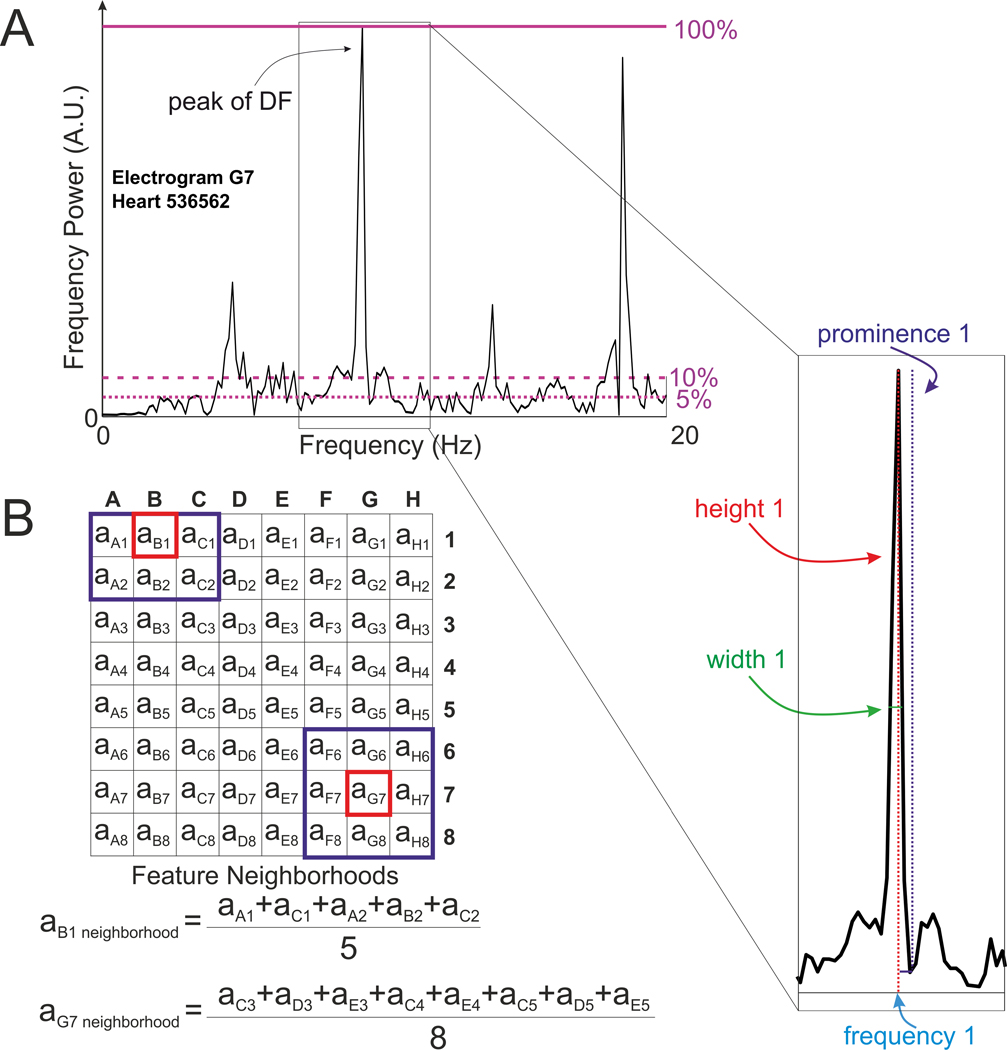
Figure 2.
Features Calculation for Machine Learning Algorithm. (A) - Example of Fourier spectra for MEM recording with several of the 35 features labeled. The height of the highest peak (peak of DF) is indicated as purple line at 100%, the numbers of peaks above two thresholds of 5 and 10 % of the highest peak’s height (dashed purple lines) were also used as features for Machine Learning algorithm. (B) - Calculation of the contribution of electrode neighborhood features at each electrode. DF = Dominant Frequency, A.U. = Arbitrary Units.

