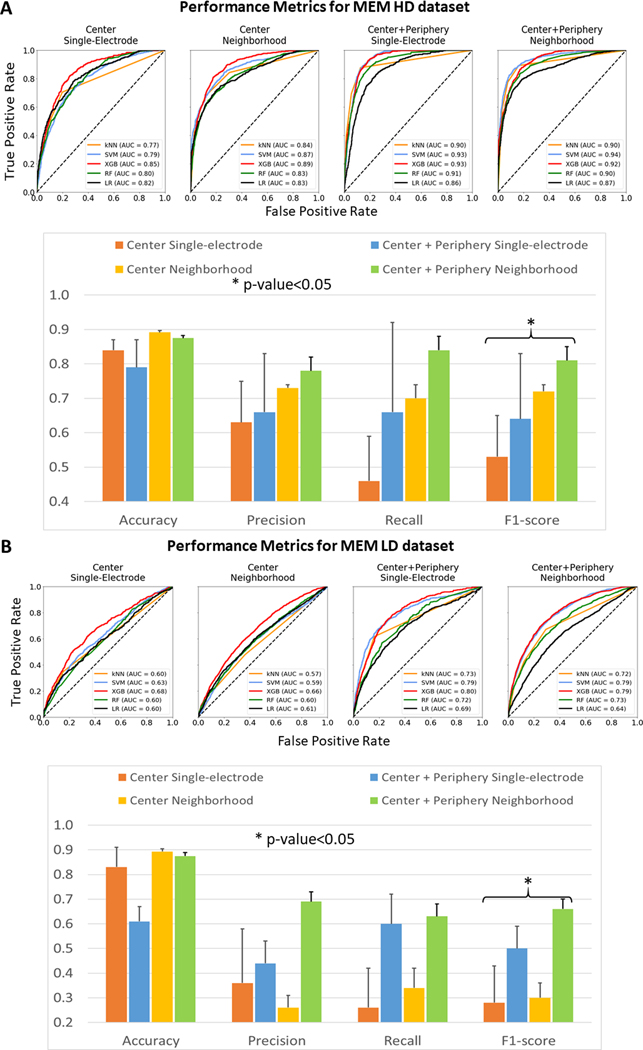
Figure 4.

Performance Metrics for HD and LD datasets. (A) - The ROC curves for different feature sets of AF HD dataset as analyzed by 5 algorithms. Below, performance metrics of binary classification into AF reentrant driver vs non-driver recordings from AF HD dataset for different feature sets. Asterisk shows the significant difference between any two metrics within group of three. (B) - The ROC curves for different feature sets of AF HD dataset as analyzed by 4 algorithms. Below, performance metrics of binary classification into AF reentrant driver vs non-driver recordings from AF LD dataset for different feature sets. Asterisk shows the significant difference between any two metrics within the group by ANOVA. Abbreviations as in Figure 3, LD = Lower-Density catheter, HD = Higher-Density catheter.
