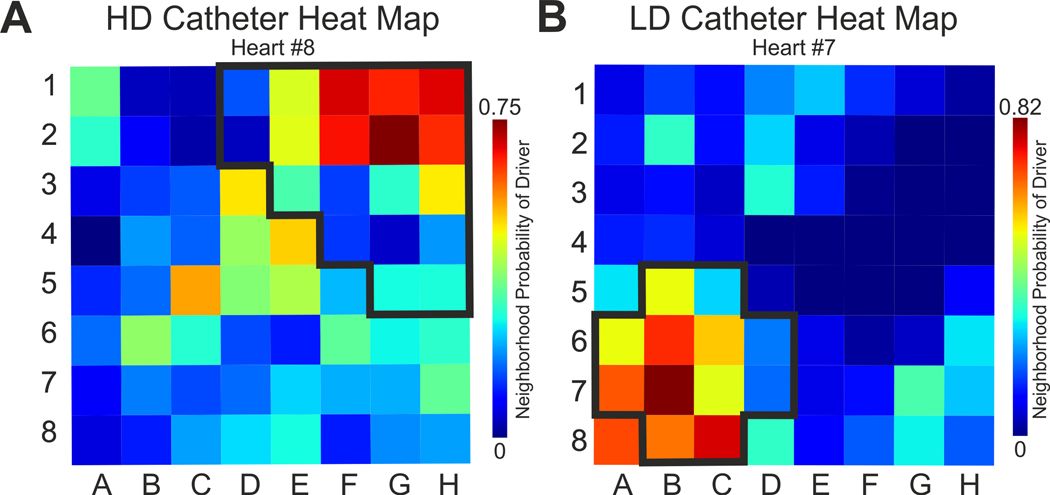
Figure 6.
Driver Prediction on 64 Electrodes Catheters. Examples of the Machine Learning probability prediction heat maps for two 64-electrode catheters - (A) Higher-density (HD) catheter and (B) Lower-density (LD) catheter. Ground truth driver region (center plus periphery) is outlined by black bold line. The color bar encodes probability of an electrode to be a driver.

