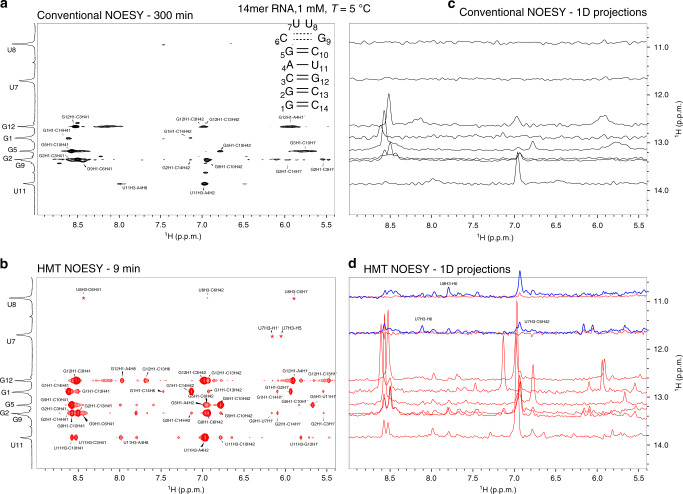
Fig. 3. HMT applied to enhance imino-derived correlations in RNAs.
a Conventional (100 ms mixing) vs b HMT NOESY spectra (17 loops with a 20 Hz inversion pulse followed by 40 ms mixing each) recorded on the 14mer on top. Both 2D spectra show the imino resonances placed along the vertical direction; for maximizing its efficiency, however, the conventional spectrum was acquired with the imino resonances along the direct domain, and was flipped in this graph to match the HMT data (otherwise, if encoding the iminos in t1, the conventional experiment showed no peaks altogether). As this was an 15N-labeled sample, looped inversions/mixing periods were preferred over continuous saturations: this avoided a constant 15N decoupling during the saturation period, which would have led to sample heating. Assignments are as labeled in the spectra; cross peaks labeled with asterisk are not visible at the given contour level. To better appreciate the enhancements, c and d show various 1D slices extracted from a and b, respectively. Shown in blue for the HMT NOESY are traces addressing U7 and U8 with a stronger (40 Hz continuous) saturation HMT scheme, revealing new correlations despite these sites’ >30 s−1 solvent exchange rates. All spectra were acquired at 1 GHz using a Bruker Avance Neo spectrometer equipped with a TCI cryoprobe.

