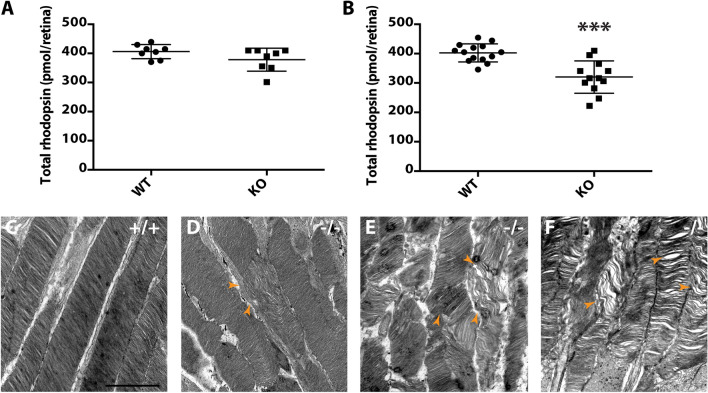
Figure 3.
Reduced rhodopsin concentration and aberrant ultrastructure of photoreceptor OS during disease progression in Prcd-KO mice. (A) Quantification of total rhodopsin (pmol rhodopsin/retina) in WT and Prcd-KO retina at P30. (B) Quantification of total rhodopsin (pmol rhodopsin/retina) in WT and Prcd-KO retina at P120. Data is reported as the mean (unpaired, two-tailed t-test; ***p = .000072). (C) TEM image of the photoreceptor OS and well organized disc membranes at P120 (WT). (D-F) TEM ultrastructure of photoreceptor OS at various ages in Prcd-KO retina show the progressive disruption of OS structure from (D) P30, (E) P60, and (F) P120. Arrowheads indicate the defective and disorganized disc membranes. Scale bar = 500 nm.

