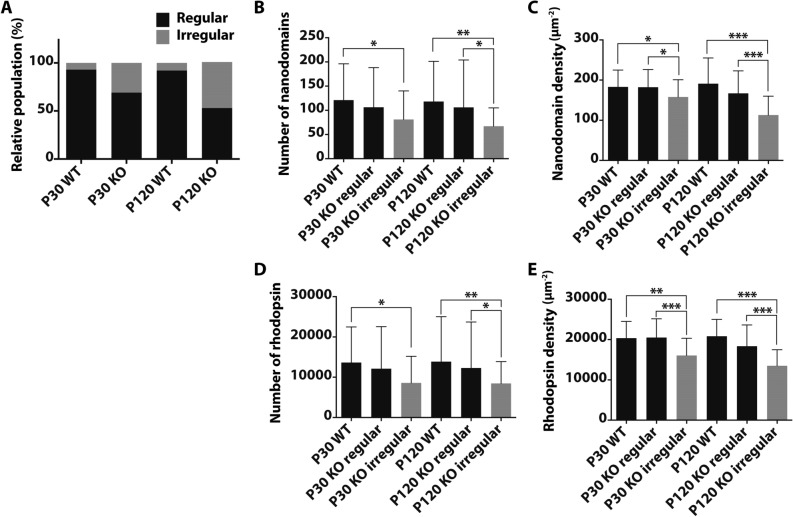
Figure 5.
Quantification of ROS disc membrane properties of WT and Prcd-KO mice. (A) Relative population of regular (black) and irregular discs (grey). (B) Number of rhodopsin nanodomains packed into a ROS disc membrane. (C) Density of rhodopsin nanodomains within a ROS disc membrane. (D) Number of rhodopsin molecules packed into a ROS disc membrane. (E) Density of rhodopsin molecules within a ROS disc membrane. The number of ROS disc membranes analyzed are as follows: P30 WT, n = 48; P30 KO regular, n = 61; P30 KO irregular, n = 27; P120 WT, n = 47; P120 KO regular, n = 53; P120 KO irregular, n = 48. Mean values are reported with the standard deviation (unpaired, two-tailed t-test; *p ≤ 0.05, **p ≤ 0.01, ***p ≤ .00001).

