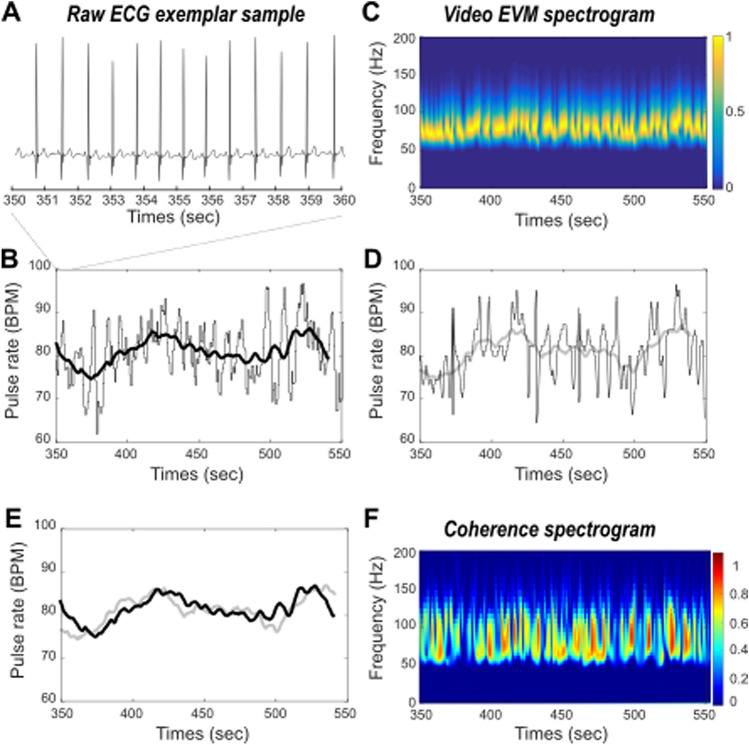
Figure 2.
Comparing ECG and EVM HR estimates. (A) Raw ECG exemplar sample. (B) ECG inter-peak interval estimate (gray) and pulse rate running average (black) in time. (C) Time frequency spectrogram of EVM processed video data. Highest power frequency band (yellow) corresponds to the HR estimate. (D) EVM peak frequency estimate (gray) and corresponding pulse rate running average (light gray) in time. (E) Overlay of ECG (black) and EVM (light gray) based running average pulse rates estimates in time. (F) Coherence between ECG and EVM HR estimates.

