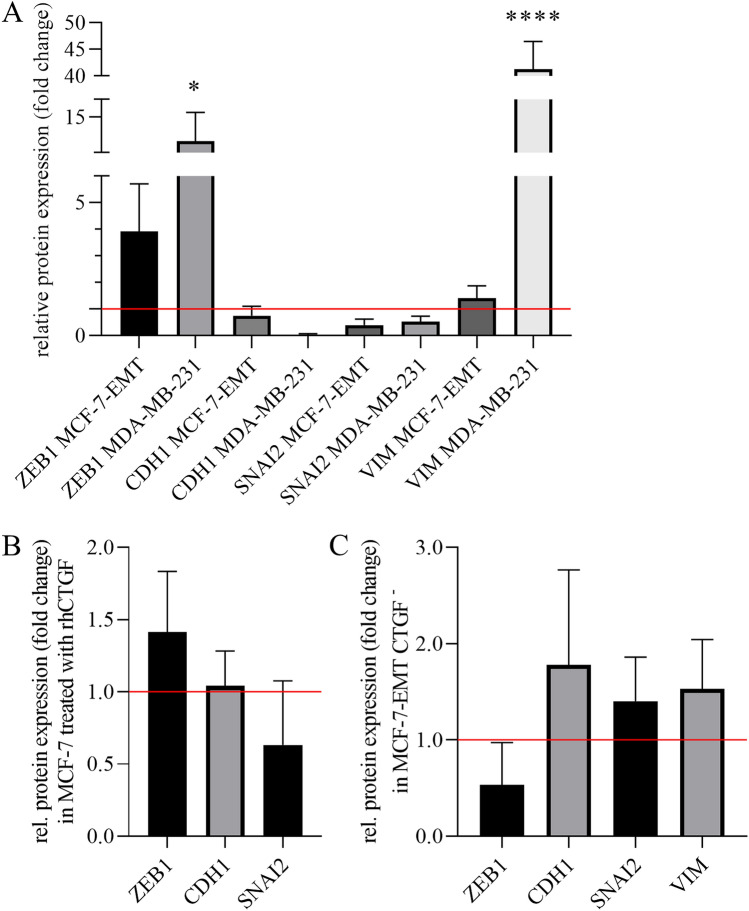
Figure 6.
CTGF regulates protein expression of potential drivers of invasion and EMT-markers. (A) Relative quantification of ZEB1, CDH1, SNAI2 and VIM protein expression in mesenchymal transformed MCF-7-EMT and MDA-MB-231 breast cancer cells in comparison to MCF-7 breast cancer cells. Data represent mean ± SEM. n = 3 using one-way ANOVA with F = 39.31 and a Dunnett ‘s multiple comparison test with no matching or pairing between groups. *P < 0.05; ****P < 0.0001 (B) Relative quantification of ZEB1, CDH1 and SNAI2 protein expression in MCF-7 cells treated with rhCTGF. Data represent mean ± SEM. n = 3 using one-way ANOVA with F = 3.123 and a Dunnett ‘s multiple comparison test with no matching or pairing between groups. (C) Relative quantification of ZEB1, CDH1, SNAI2 and VIM protein expression in mesenchymal transformed breast cancer cells (MCF-7-EMT) treated transiently with CTGF siRNA for 48 h. Data represent mean ± SEM. n = 3 using one-way ANOVA with F = 2.191 and a Dunnett ‘s multiple comparison test with no matching or pairing between groups.

