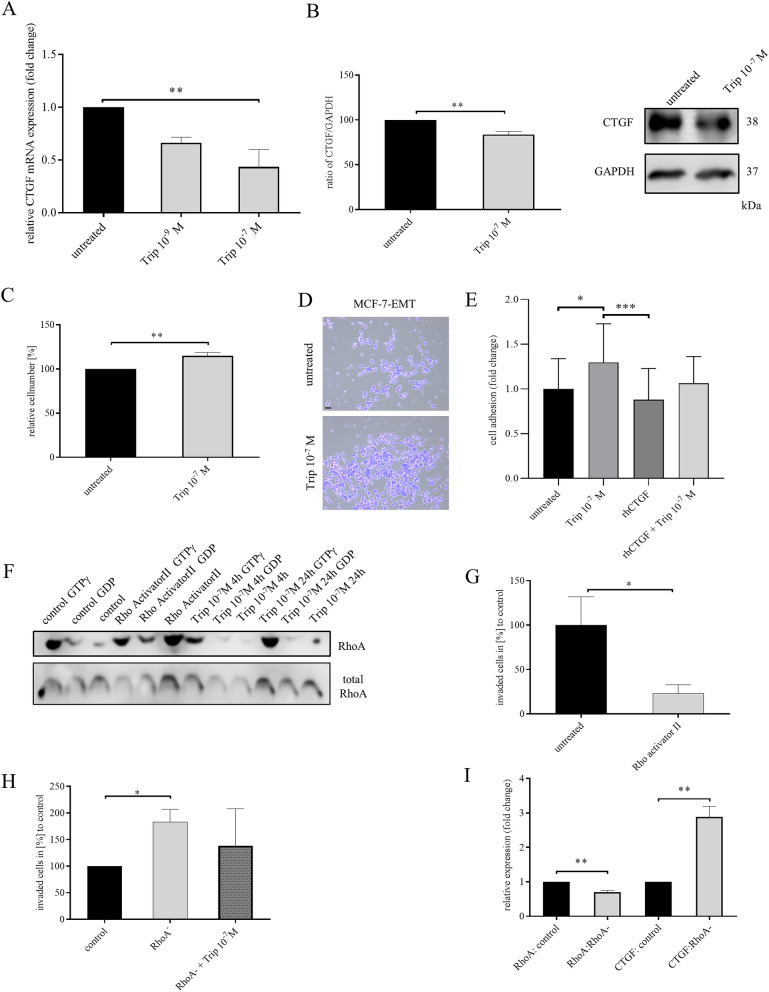
Figure 7.
GnRH agonist regulates CTGF through RhoA activity in mesenchymal transformed breast cancer cells. (A) Relative quantification of CTGF mRNA expression in mesenchymal transformed breast cancer cells (MCF-7-EMT) treated for 48 h with 10-9 M or 10-7 M Triptorelin. Data represent mean ± SEM. MCF-7-EMT n = 3 using one-way ANOVA with F = 8.366 and a Dunnett ‘s multiple comparison test with no matching or pairing between groups. **P < 0.01 (B) Quantification and representative experiment of CTGF protein expression after Triptorelin treatment for 48 h (10-7 M). CTGF band intensity was quantified by densitometry and normalized to GAPDH. Lower panel shows loading control GAPDH that was detected in the same sample and were run in the same gel lane and detected in the same Western blot membrane. Data represent mean ± SEM. MCF-7-EMT n = 3 using unpaired, two-tailed t-test analysis to respective control (untreated). **P < 0.01 (C) Adhesion analysis of mesenchymal transformed breast cancer cells treated with 10-7 M Triptorelin. Adhesive cells where counter-stained with crystal violet and absorption was measured at 570 nm. Data represent mean ± SEM. MCF-7-EMT n = 5 using unpaired, two-tailed t-test analysis to respective control (untreated). **P < 0.01 (D) Representative images corresponding to C. Scale bar gauges 200 µm. (E) Adhesion analysis of mesenchymal transformed breast cancer cells treated with 10-7 M Triptorelin, rhCTG or rhCTGF and Triptorelin. Data represent mean ± SEM. n = 24 using one-way ANOVA with F = 5.784 and a Tukey ‘s multiple comparison test with no matching or pairing between groups. *P < 0.05; ***P < 0.001 (F) RhoA activity pull-down of untreated MCF-7-EMT cells, MCF-7-EMT cells treated 3 h with an specific Rho activator (1 µg/ml) and MCF-7-EMT cells treated with 10-7 M Triptorelin for 4 or 24 h. Lower panel shows total RhoA that was detected in the same sample and were run in the same gel lane and detected in the same Western blot membrane. (G) 2D invasion assay. After 48 h treatment with or without Rho activator II treatment (1 µg/ml) supplement invaded cells under filter were counted in four randomly selected regions. Data represent mean ± SEM. MCF-7-EMT n = 7 using unpaired, two-tailed t-test analysis to respective control (untreated). *P < 0.05 (H) Following transient RhoA siRNA transfection without or with treatment with 10-7 M Triptorelin invaded cells under filter was counted in four randomly selected regions. Data represent mean ± SEM. n = 9 using one-way ANOVA with F = 4.780 and a Tukey ‘s multiple comparison test with no matching or pairing between groups. *P < 0.05 (I) Relative quantification of RhoA and CTGF mRNA expression in MCF-7 cells after transient RhoA transfection (t0h). Data represent mean ± SEM. M n = 3 using unpaired, two-tailed t-test analysis to respective control. **P < 0.01.

