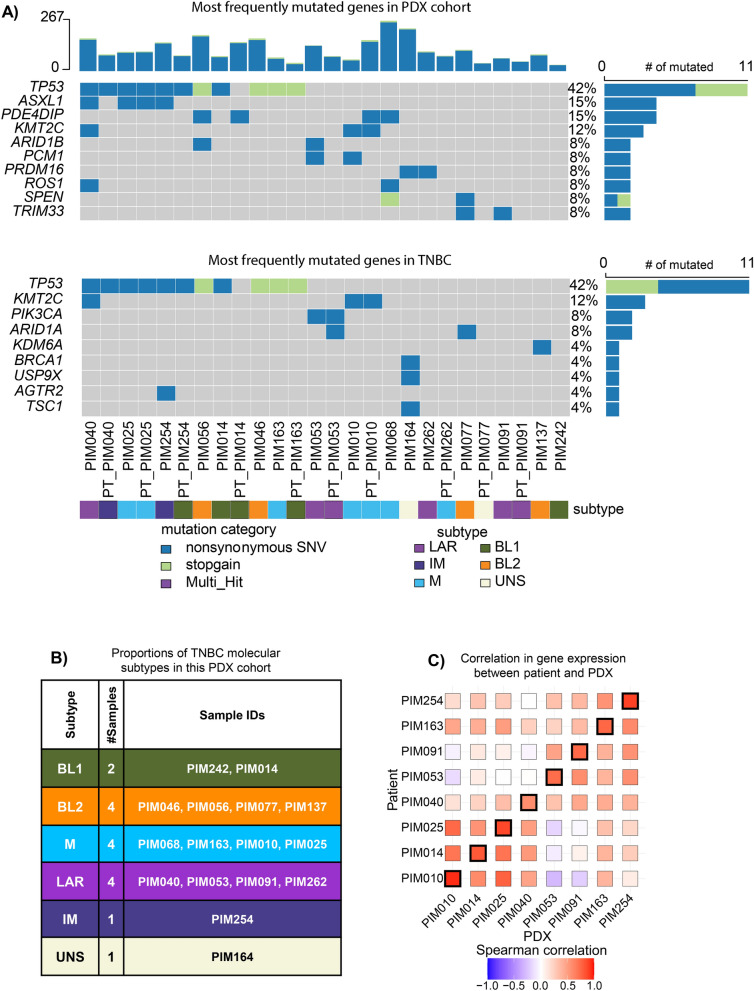
Figure 2.
Characterization of PDX models. (A) Oncoplot of the most frequently mutated genes found in our PDX cohort and also found in TNBC22. Genomic samples from patients are denoted with a PT_ prefix prepended to their respective PDX surrogate. (B) Molecular subtypes determined from PDX gene expression profile: BL1, basal-like 1; BL2, basal-like 2; IM, immunomodulatory; LAR, luminal androgen receptor; M, mesenchymal; UNS, unstable. (C) Correlative analysis of the 1000 most variant gene transcripts from RNA sequencing between patient tumors and PDX model.

