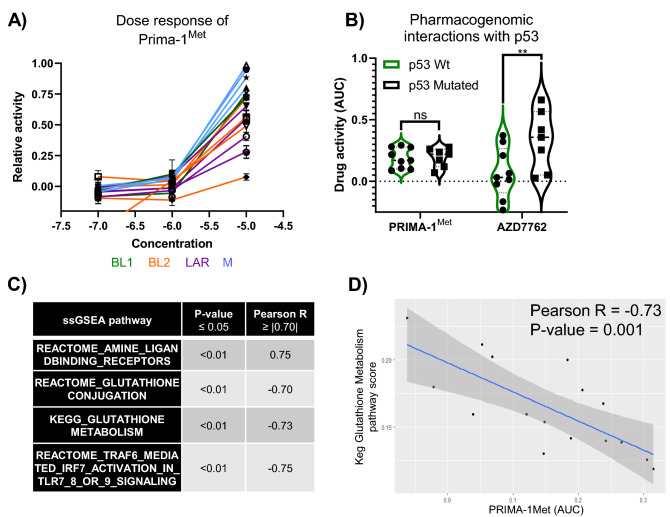
Figure 6.
Prima-1Met pharmaco-genomic and transcriptomic associations. (A) Dose–response curve from primary screen. (B) Violin plot of AUC values vs TP53 status for Prima-1Met (p > 0.999) and AZD7762 (p < 0.01). (C) List of ssGSEA pathways that had a significant (p < 0.05) and strong correlation (absolute value of Pearson r coefficient ≥ 0.70) with the AUC of Prima-1Met. (D) Example of the correlation between Prima-1Met to KEGG glutathione metabolism pathway activity.

