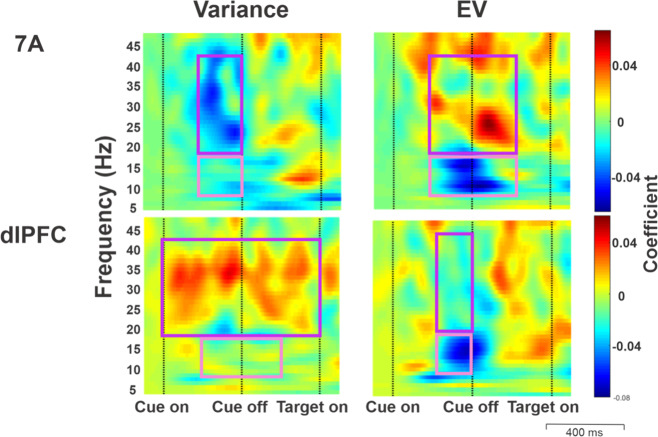
Fig. 5. Variance and EV affect LFP oscillations in the α, β, and γ frequency bands.
Time-frequency maps of GLM coefficients indicating the effects of variance and EV on LFP power. Each pixel is a GLM coefficient obtained from fitting the LFP power spectrum across all the trials available in each monkey and averaging across monkeys (see “Methods, LFP pre-processing”). The rectangles superimposed on each map indicate the regions of interest (ROI) where consistent effects were found in both monkeys, in the α/low-β (8–18 Hz, pink) and high-β/low-Υ (18–43 Hz, purple) frequency bands.

