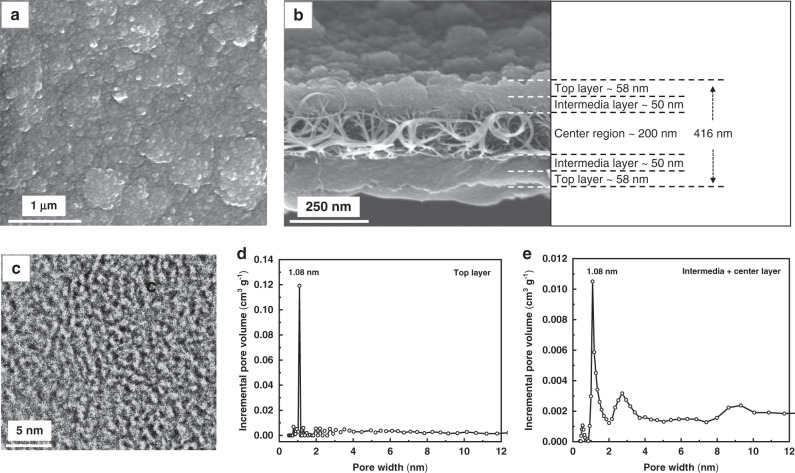
Fig. 3. Membrane structure and pore size distribution of the CNT-EP-PC15 membrane.
a Top-view SEM image. b cross-section SEM image and the illustrated three membrane regions from top to the center. c TEM image of the top polycarbazole layer d Pore size distribution of the top polycarbazole layer. e Pore size distribution of the intermediate and central regions. The pore size distribution was calculated from the corresponding N2 adsorption isotherm using the NLDFT method.

