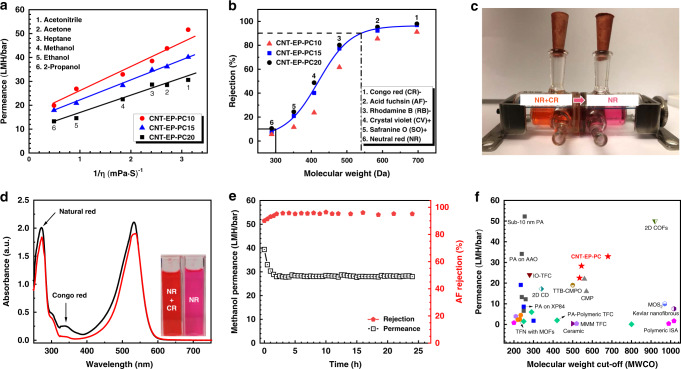
Fig. 5. Performance of organic solvent nanofiltration and separation of dyes.
a Permeances of some common polar and nonpolar organic solvents under the transmembrane pressure drop of 1 bar vs. the inverse solvent viscosity on CNT-EP-PC membranes that have a thickness of 350 nm (CNT-EP-PC10), 416 nm (CNT-EP-PC15), and 528 nm (CNT-EP-PC20). b Rejection of dyes with different molecular weights under the transmembrane pressure drop of 1 bar. c Separation of mixed dyes by a CNT-EP-PC15 membrane through a diffusion cell. The chamber on the left side contained equal concentrations of Natural Red (NR) and Congo Red (CR) dyes, whereas the chamber on the right side was filled with pure methanol initially and turned red (NR) after 1 day of diffusion. d UV-vis spectra of the mixed dyes in the left chamber (black curve) and right chamber (red curve) of the diffusion cell in c. e Long-term filtration test of the CR/methanol solution on the CNT-EP-PC15 membrane. f Performance comparison of the CNT-EP-PC15 membrane with some best-reported nanofiltration membranes.

