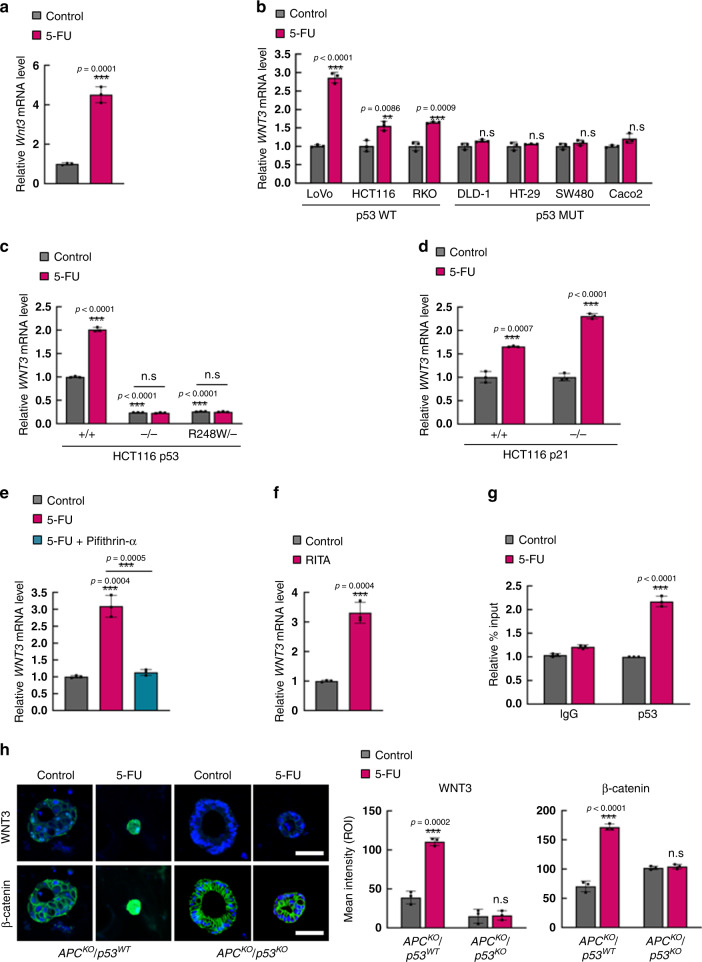
Fig. 4. 5-FU activates WNT/β-catenin signaling via p53-dependent WNT3 transcrpition.
a Relative mRNA levels of Wnt3 in ApcMin/+/Lgr5EGFP mouse tumor organoids after treatment with 5-FU (1.5 μg/ml, 48 h). (n = 3 biologically independent samples per group). b Relative mRNA levels of WNT3 in various CRC cell lines after 5-FU treatment. (n = 3 biologically independent samples per group). c Relative mRNA levels of WNT3 in p53+/+, p53−/−, and p53R248W/− isogenic HCT116 cell lines after 5-FU treatment. (n = 3 biologically independent samples per group). d Relative mRNA levels of WNT3 in p21+/+ and p21−/− isogenic HCT116 cell lines after 5-FU treatment. (n = 3 biologically independent samples per group). e Relative mRNA levels of WNT3 in HCT116 cells treated with or without 5-FU and pifithrin-α (10 μM, 48 h). (n = 3 biologically independent samples per group). f Relative mRNA level of WNT3 in HCT116 cells treated with our with RITA (5 μM, 48 h). (n = 3 biologically independent samples per group). g Relative percentage input of ChIP-qPCR analysis of WNT3 promoter using indicated antibodies in HCT116 cells after treatment with 5-FU. (n = 3 biologically independent samples per group) h Confocal images of WNT3 (green) and β-catenin (green) with DAPI in APCKO/p53WT and APCKO/p53KO human colon organoids treated with or without 5-FU. Scale bar = 50 μm. Quantification of mean intensities of WNT3 and β-catenin in Fig. 4h. The mean intensities were measured by Zen software 3.1. (n = 3 biologically independent samples per group) Data are mean ± s.d., two-sided Student’s t-test, n.s. not significant, *p < 0.05, **p < 0.01, ***p < 0.001. Source data are provided as a Source data file.

