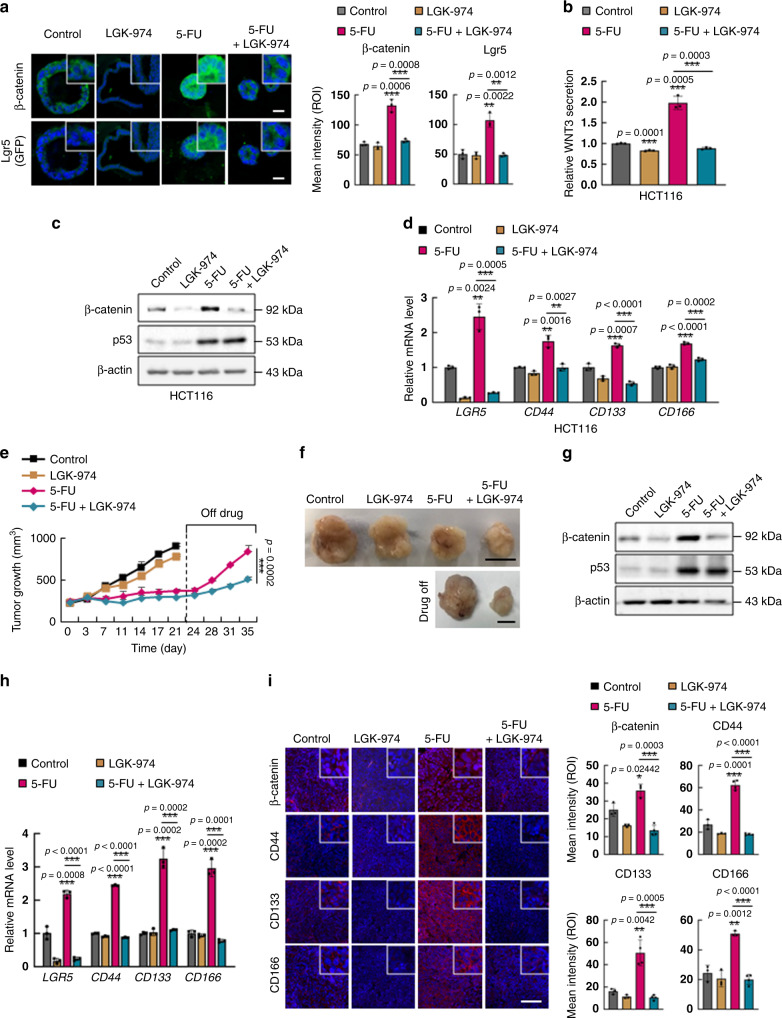
Fig. 5. WNT inhibition suppresses 5-FU-induced enrichment of CSCs and tumor regrowth.
a Confocal images of β-catenin (green) and Lgr5 (GFP) (green) in ApcMin/+/Lgr5EGFP intestinal tumor organoids co-treated with 5-FU (1.5 μg/ml, 48 h) and LGK-974 (5 μM, 48 h) (left panel) and quantification of the mean intensities (right panel). Scale bar = 50 μm. (n = 3 biologically independent samples per group). b Measurement of WNT3 secretion by ELISA analyses using 12 h cultured medium of HCT116 cells after co-treatment with 5-FU and LGK-974. (n = 3 biologically independent samples per group). c Immunoblots of indicated proteins in HCT116 cells co-treated with 5-FU and LGK-974. d Relative mRNA levels of CSC markers LGR5, CD44, CD133, and CD166 in HCT116 cells co-treated with 5-FU and LGK-974. (n = 3 biologically independent samples per group). e–i HCT116 cells were xenografted in mice and tumors were extracted and analyzed after co-treatment with 5-FU (25 mg/kg) and LGK-974 (5 mg/kg) daily for 21 days followed by discontinuation of treatment for 14 days. e Growth of tumors were measured at the indicated days after treatments. (n = 5 in D0, D3, D7, D11, D14, D17, and D21 biologically independent animals per group and n = 4 in D24, D28, D31 biologically independent animals per group). f Gross images of tumors. Scale bar = 10 mm. g Immunoblots of indicated proteins in isolated tumors after indicated treatment for 21 days. h Relative mRNA levels of LGR5, CD44, CD133, and CD166 in isolated tumors after indicated treatment for 21 days. (n = 3 biologically independent samples per group). i Immunohistochemistry analysis of indicated proteins in sections of isolated tumors after treatment for 21 days and quantification of mean intensities. Scale bar = 100 μm. The mean intensities were measured by Zen software 3.1. (β-catenin n = 3 in Control, LGK-974 and 5-FU, and n = 4 in 5-FU+LGK-974 group, CD44 n = 3 in Control, LGK-974, and n = 4 in 5-FU and 5-FU+LGK-974 group, CD133 n = 3 in Control, LGK-974, and n = 4 in 5-FU and 5-FU+LGK-974 group, CD166 n = 3 in Control, LGK-974 and 5-FU, and n = 4 in 5-FU + LGK-974 group). Data are mean ± s.d., two-sided Student’s t-test, **p < 0.01, ***p < 0.001. Source data are provided as a Source data file.

