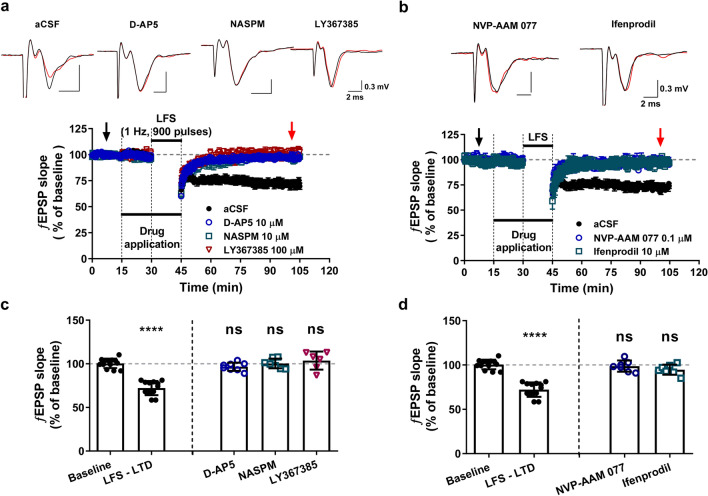
Figure 1.
Determining NMDAR-dependent LTD in the LHb regions. (a, b) Top, The proposed ƒEPSP sweep shows the change in baseline (black trace, from black arrow in bottom) and after 55 min of LFS transmission (red trace, from red arrow in bottom). Bottom, The LFS (900 pulses at 1 Hz) elicited robust LTD. The regulation of LFS-induced LTD by selective glutamate receptor antagonists (a) and NMDAR subtype antagonists (b). (c) Summary histogram showing modulation of LTD by selective glutamate receptor antagonists (one-way ANOVA, F[4, 42] = 39.14; Dunnett’s post-hoc test as condition vs. baseline; LFS-LTD, 71.9 ± 4.2%, n = 10, ****P < 0.0001; D-AP5, 96.7 ± 1.7%, n = 8, ns, P = 0.5884; NASPM, 100.4 ± 2.1%, n = 7, ns, P > 0.9999; LY367385, 103.7 ± 4.2%, n = 6, ns, P = 0.7828). (d) Bar graph shows LTD is regulated by selective NMDAR subtype antagonist (one-way ANOVA, F[4, 42] = 37.97; Dunnett’s post-hoc test as condition vs. baseline; NVP-AAM 077, 99.1 ± 2.7%, n = 7, ns, P = 0.9533; ifenprodil, 97.4 ± 3.0%, n = 7, ns, P = 0.2148).

