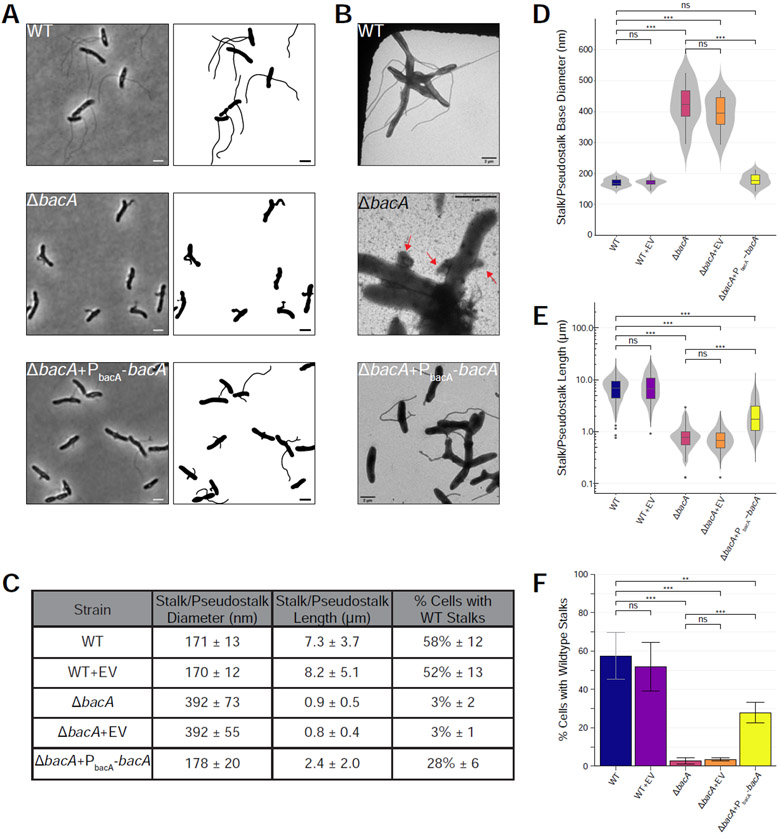
Figure 2. BacA is Required for WT Stalk Synthesis.
Analysis of stalk morphology in strains YB642 (WT), YB9183 (WT + pMR10 empty vector control), YB8597 (ΔbacA), YB8620 (ΔbacA + pMR10 empty vector control), and YB8601 (ΔbacA + pMR10-PbacA-bacA). Cells were grown in rich medium (PYE) to saturation and sub-cultured into phosphate limited (HIGG) medium at 26°C for 72h (see culturing details in Experimental Model and Subject Details). (A) Phase microscopy (left) and cell silhouette (right) for strains YB642 (WT), YB8597 (ΔbacA), and YB8601 (ΔbacA + pMR10-PbacA-bacA). Scale bars = 2 μm. (B) Transmission electron microscopy (TEM) for strains YB642 (WT), YB8597 (ΔbacA), and YB8601 (ΔbacA+pMR10-PbacA-bacA). ΔbacA pseudostalks are indicated with red arrows. Scale bars = 2 μm. (C) Summary statistics for data presented in Figure 2D, 2E, and 2F. Data shown is mean (SD). (D) Distribution of stalk/pseudostalk base diameter in the populations. Data (WT n=13; WT+EV n=19; ΔbacA n=8; ΔbacA+EV n=13; ΔbacA+PbacA-bacA n= 17) are from single samples with five TEM fields per sample. Data are represented as box and whisker plots [52] where the middle line represents the median, the lower and upper hinges correspond to the first and third quartiles (the 25th and 75th percentiles), and the upper whisker extends from the hinge to the largest value no further than 1.5 * IQR from the hinge (where IQR is the inter-quartile range, or distance between the first and third quartiles). The lower whisker extends from the hinge to the smallest value at most 1.5 * IQR of the hinge. Data beyond the end of the whiskers are called "outlying" points and are plotted individually. A mirrored density violin plot [53] is underlaid to show the continuous distribution of the data. Violin plots have been scaled to the same width. (***p ≤ 0.001, ns = not significant; two-sided t-test). (E) Distribution of stalk/pseudostalk lengths in the populations, measured from the tip of the structure to the cell body. Data (WT n=412; WT+EV n=321; ΔbacA n=153; ΔbacA+EV n=148; ΔbacA+PbacA-bacA n=324) are from three independent biological replicates with five phase microscopy fields per replicate. Data are plotted on a log10 scale y-axis and are represented as box and whisker plots and violin plots in the same manner as Figure 2D. As length data are approximately log-normally distributed, significant difference testing was performed on log10 transformed data (***p ≤ 0.001, ns = not significant; two-sided t-test). (F) Percentage of cells with WT stalks. Cells in phase images from Figure 2A were scored as having a WT stalk (i.e. a thin extension from the cell body). Cells exhibiting thick and aberrant pseudostalks were excluded. Data (total cells counted: WT n=735; WT+EV n=615; ΔbacA n=841; ΔbacA+EV n=1259; ΔbacA+PbacA-bacA n=831) are from four independent biological replicates with five phase microscopy fields per replicate. Data are represented as the mean (SD) percentage of cells with stalks. (***p ≤ 0.001, **p ≤ 0.01, ns = not significant > 0.05; two-sided t-test). See also Figure S1.

