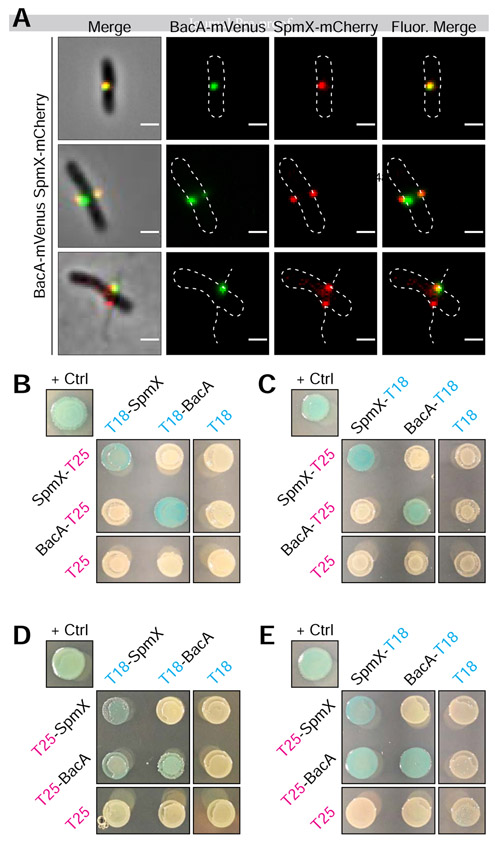
Figure 5. BacA-mVenus and SpmX-mCherry in vivo Colocalization and Bacteria Adenylate Cyclase Two-Hybrid (BACTH) Assays Showing in vivo Interaction of SpmX and BacA.
(A) Representative images of dual labeled strain YB9466 (bacA::bacA-mVenus spmX::spmX-mCherry), with a cell exhibiting almost complete overlap of signals (top), a cell exhibiting BacA-mVenus and SpmX-mCherry foci at both putative sites of stalk synthesis (middle), and a cell with WT stalks, showing functionality of the fusion proteins (bottom). Pearson's Correlation Coefficient (PCC) was used to quantify colocalization of signal intensity between the two fluorophore channels (BacA-mVenus and SpmX-mCherry) within the cells. PCC values range from −1 indicating a strong negative correlation (anticolocalization) to +1 indicating a strong positive correlation (colocalization), with a value of 0 indicating no correlation (noncolocalization). Only cells that contained both BacA-mVenus and SpmX-mCherry foci located at the midcell were used (n = 179). Mean (SD) PCC = 0.48 ± 0.23, showing an overall positive correlation. (B-E) BTH101 E. coli were co-transformed with T25 and T18 based recombinant plasmids. Transformants were then grown in selective medium containing 0.5 mM IPTG and patched on selective indicator plates containing X-gal 40 μg ml−1 and 0.5 mM IPTG for ~24 hours at 30°C. As this is a β-galactosidase assay, blue patches indicate a positive in vivo interaction between the two recombinant proteins. Positive control ("+ Crtl") for all assays is T25-Zip and T18-Zip fusion proteins. Negative controls are unfused T18 or T25 fragments in combination with the experimental fusion protein or the cognate unfused T25 or T18 fragments. Patches shown are representative of independent biological triplicates for each combination. (B) C-terminal fused T25 + N-terminal fused T18. (C) C-terminal fused T25 + C-terminal fused T18. (D) N-terminal fused T25 + N-terminal fused T18. (E) N-terminal fused T25 + C-terminal fused T18.

