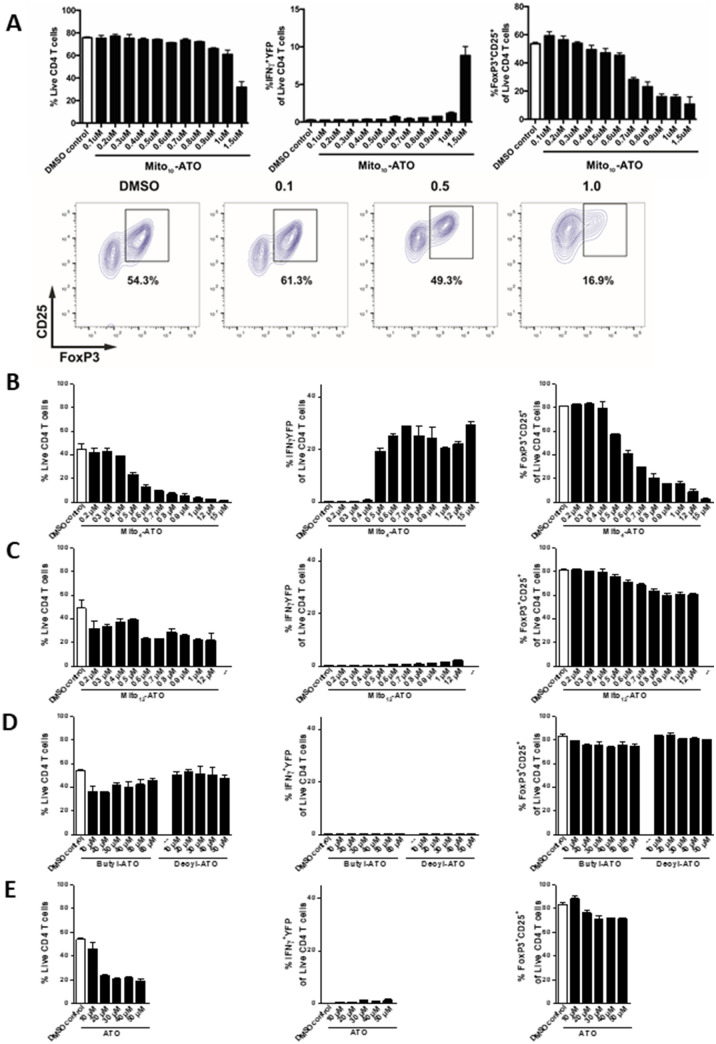
Figure 5.
In vitro differentiation of CD4+ T regulatory cells under varying concentrations of Mito-ATOs and controls. After six days of culture, cells were stained for flow cytometry analysis. (left) Live/dead staining to assess the percentage of live CD4 + T cells within the lymphocyte gate. (middle) Teff cell function is shown as the frequency of IFNγ-YFP positive cells within the live CD4+ T cells. (right) The percentage of Treg cells is shown as the frequency of FoxP3+CD25+ cells within the live CD4+ T cells. (A, bottom) Representative plot using FlowJo Software, effects of Mito10-ATO on Treg (FoxP3+CD25+) cells within the live CD4+ T cell gate (contour plots depict gating corresponding to panel A, upper right)39. Mito4-ATO (B) effectively suppressed Treg while Mito12-ATO (C), Butyl-ATO (D), Decyl-ATO (D), and ATO (E) did not suppress Treg cells.

