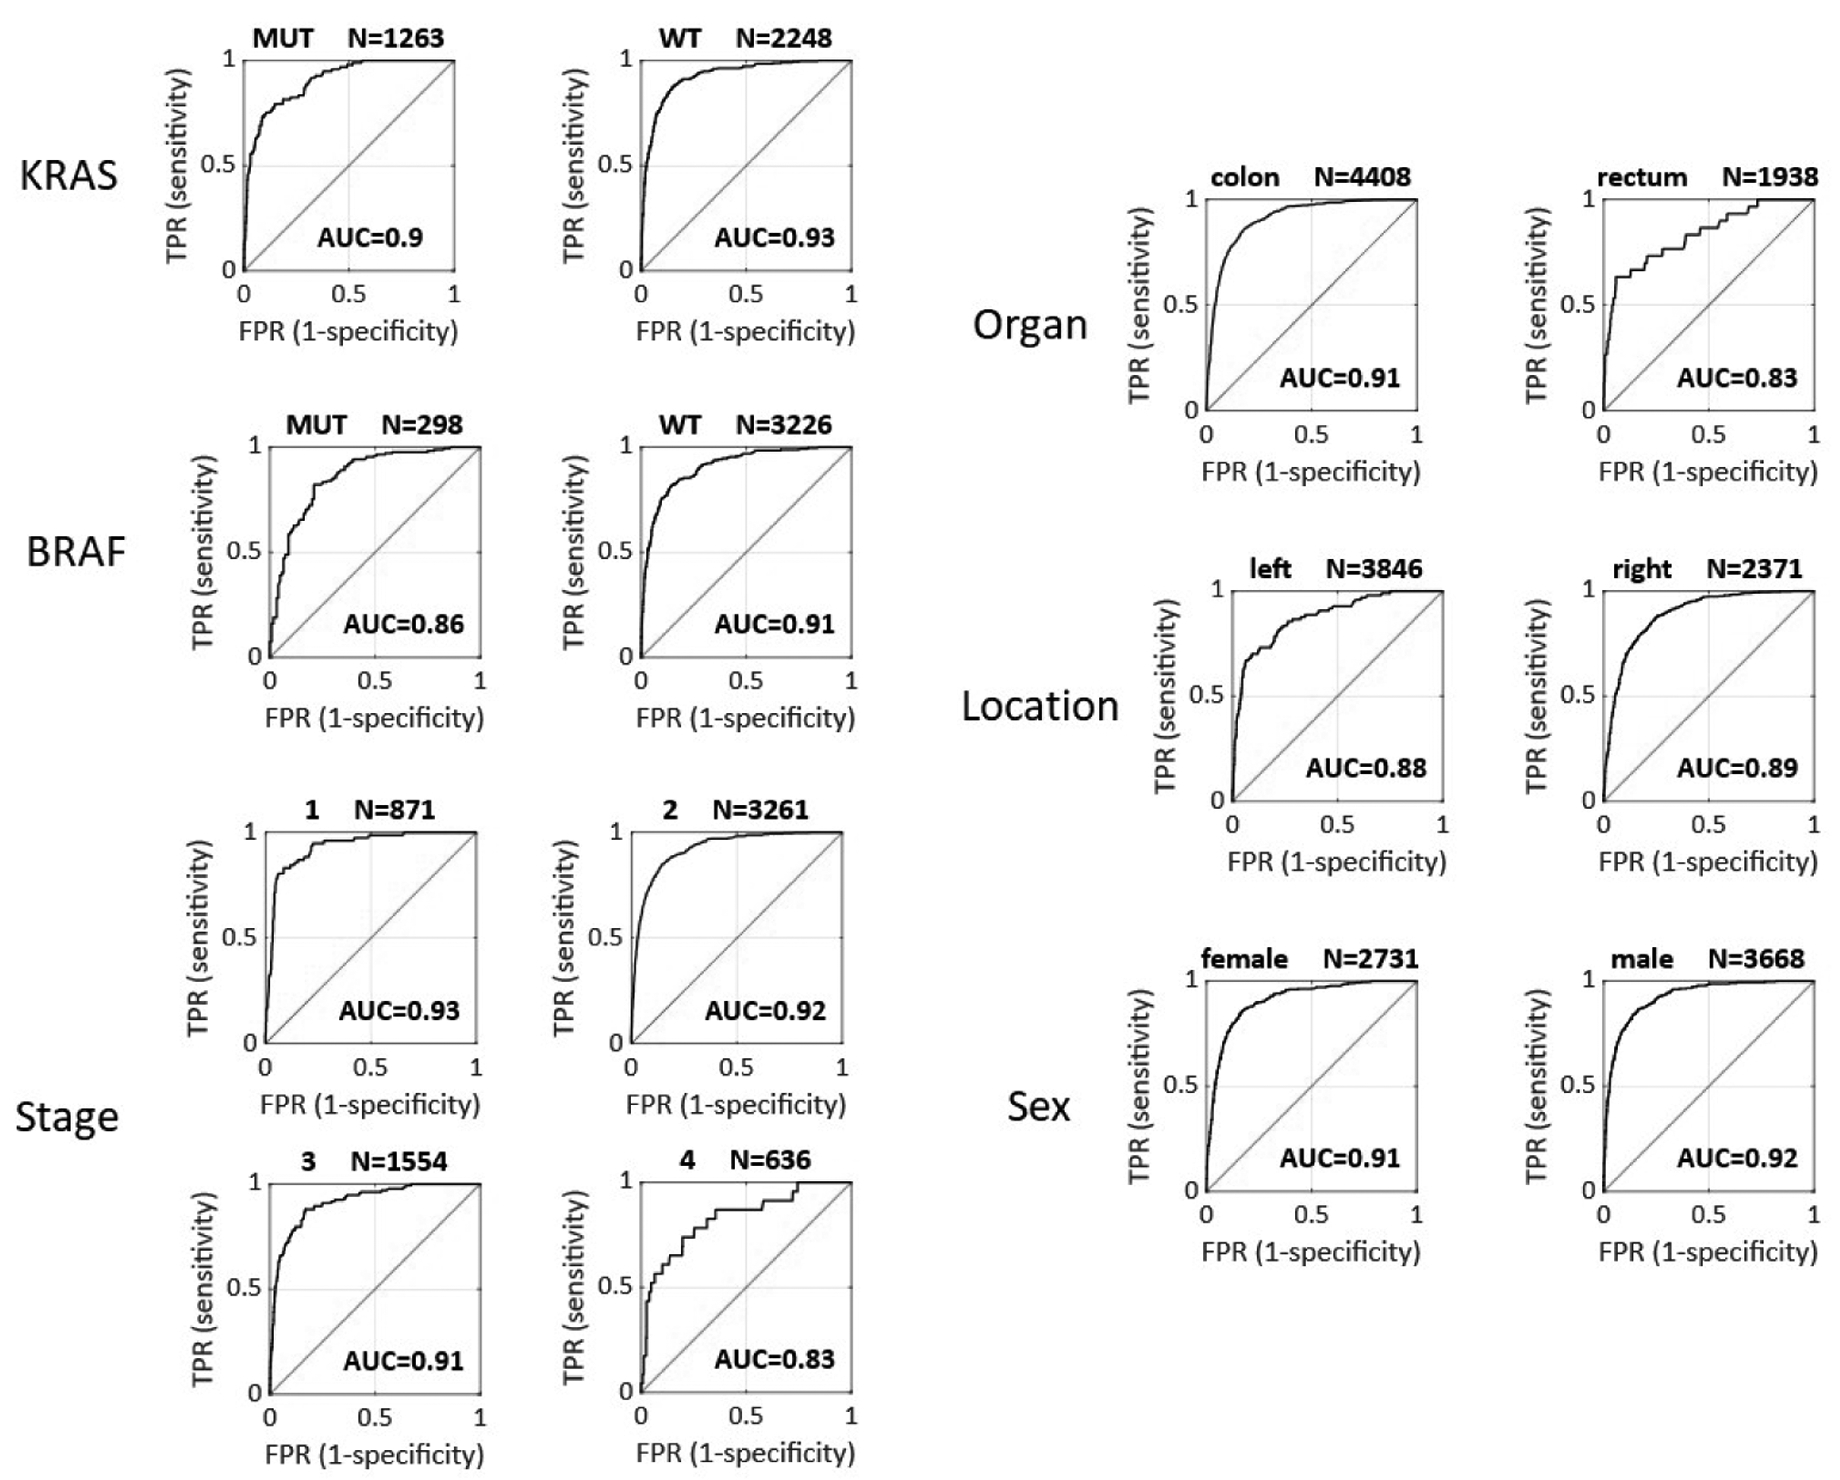
Figure 2: Cross-validated subgroup analysis for detection of MSI and dMMR in the international cohort (n=6406 patients).

AUC = area under the receiver operating curve as shown in the image, TPR = true positive rate, FPR = false positive rate, WT = wild type, MUT = mutated.
