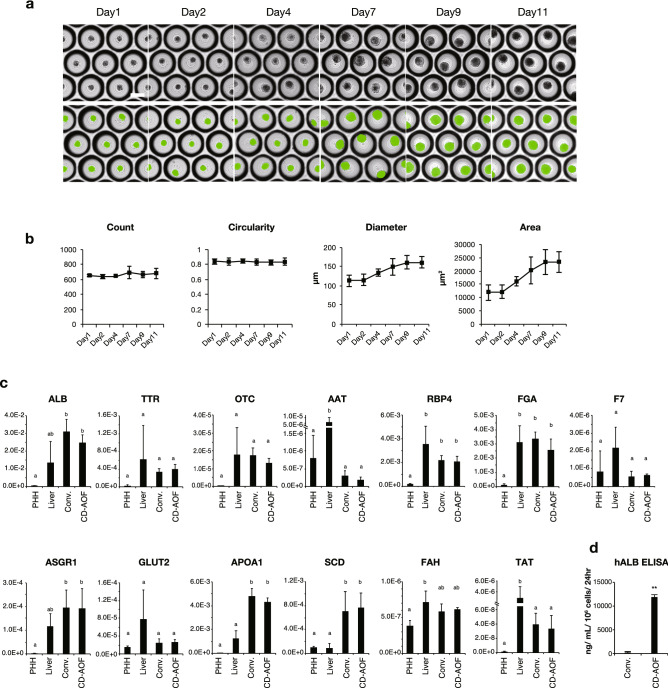
Figure 7.
Generation of all iPSC-LBs using defined medium (Step VI). (a) Morphological representation of all iPSC-LBs generated using cells differentiated in the CD-AOF medium. Green segments in the bottom panel represent successful recognition of individual LBs in dimple-well plates. Scale bar, 200 µm. (b) Morphological analysis of the LBs generated using cells differentiated in the CD-AOF medium. (c) Gene expression analysis of the LBs generated using cells differentiated in the conventional or CD-AOF medium. Error bars represent standard deviation. Bars with the different letters are significantly different according to one-way ANOVA (analysis of variance) with post-hoc Tukey HSD (honestly significant difference) test (p < 0.05). See supplementary note for detailed interpretations. PHH: primary human hepatocytes. Liver: human liver tissue. (d) Human albumin secretion in iPSC-LBs differentiated in the conventional or CD-AOF medium.

