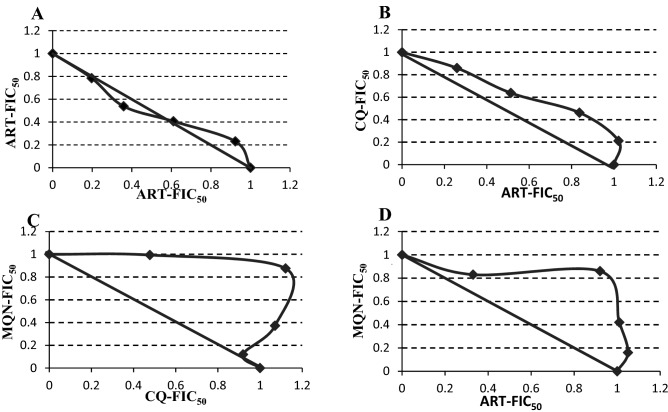
Figure 7.
Isobolograms of the in vitro interactions between moxiquindole with chloroquine or artemisinin at fixed ratio. (A) Control ART/ART; (B) Control CQ/ART; (C) MQN/CQ; (D) MQN/ART. CQ: Chloroquine; ART: Artemisinin; MQN: (±)-Moxiquindole. FIC50 = Fractional Inhibitory Concentration 50. A concave curve represents a synergistic interaction, a convex is consistent with an antagonistic interaction and a straight line is consistent with an additive interaction. Axes are EC50s normalized to 1.

