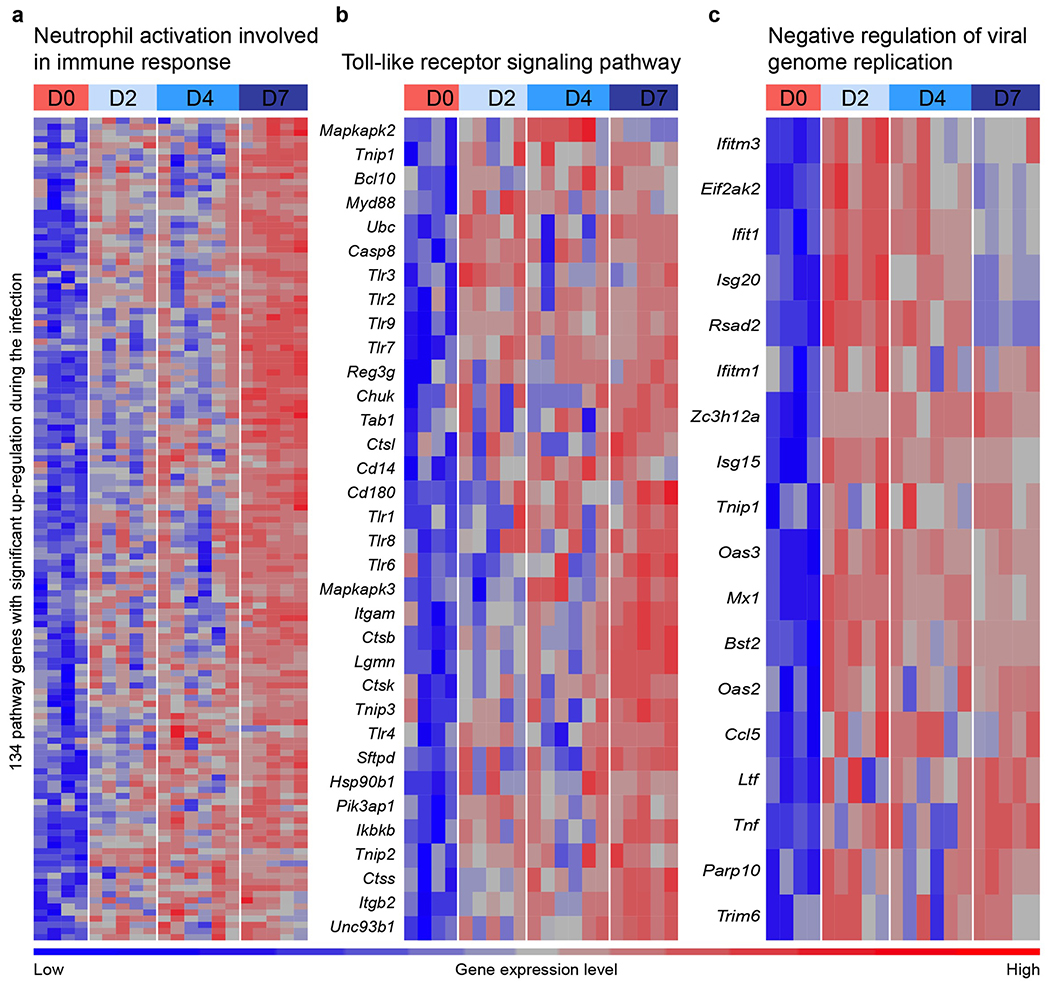
Extended Data Fig. 5. Transcriptional immune signatures following SARS-CoV-2 infection.
Heat maps of significantly upregulated genes during SARS-CoV-2 infection enriched in neutrophil activation pathways (a), Toll-like receptor signaling pathway (b), and negative regulation of viral genome replication (c) identified through Gene Ontology analysis. Genes shown in each pathway are the union of differentially expressed genes from the three comparisons (2, 4, and 7 dpi versus mock-infected). Columns represent samples and rows represent genes. Gene expression levels in the heat maps are z score-normalized values determined from log2 [cpm values]).

