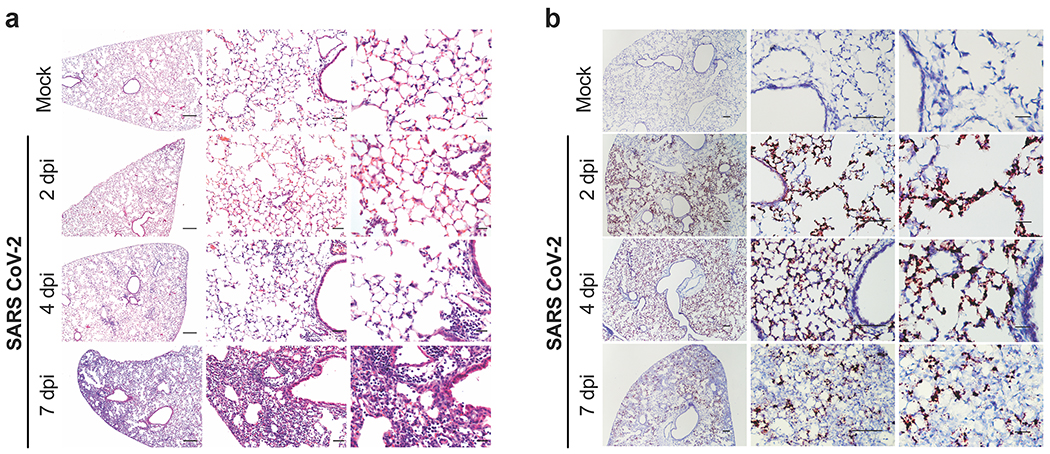
Figure 2. Histopathological analysis of SARS-CoV-2 infection in K18-hACE2 mice.
a. Hematoxylin and eosin staining of lung sections from K18-hACE2 mice following mock infection or after intranasal infection with 2.5 x 10⁴ PFU of SARS-CoV-2 at 2, 4, and 7 dpi. Images show low- (left; scale bars, 250 μm), medium- (middle; scale bars, 50 μm), and high-power magnification (right; scale bars, 25 μm). Representative images from n = 6 per group. b. SARS-CoV-2 RNA in situ hybridization of lung sections from K18-hACE2 mice for conditions in (a). Images show low- (left; scale bars, 100 μm), medium- (middle; scale bars, 100 μm), and high-power magnification (right; scale bars, 10 μm). Representative images from n = 6 per group.

