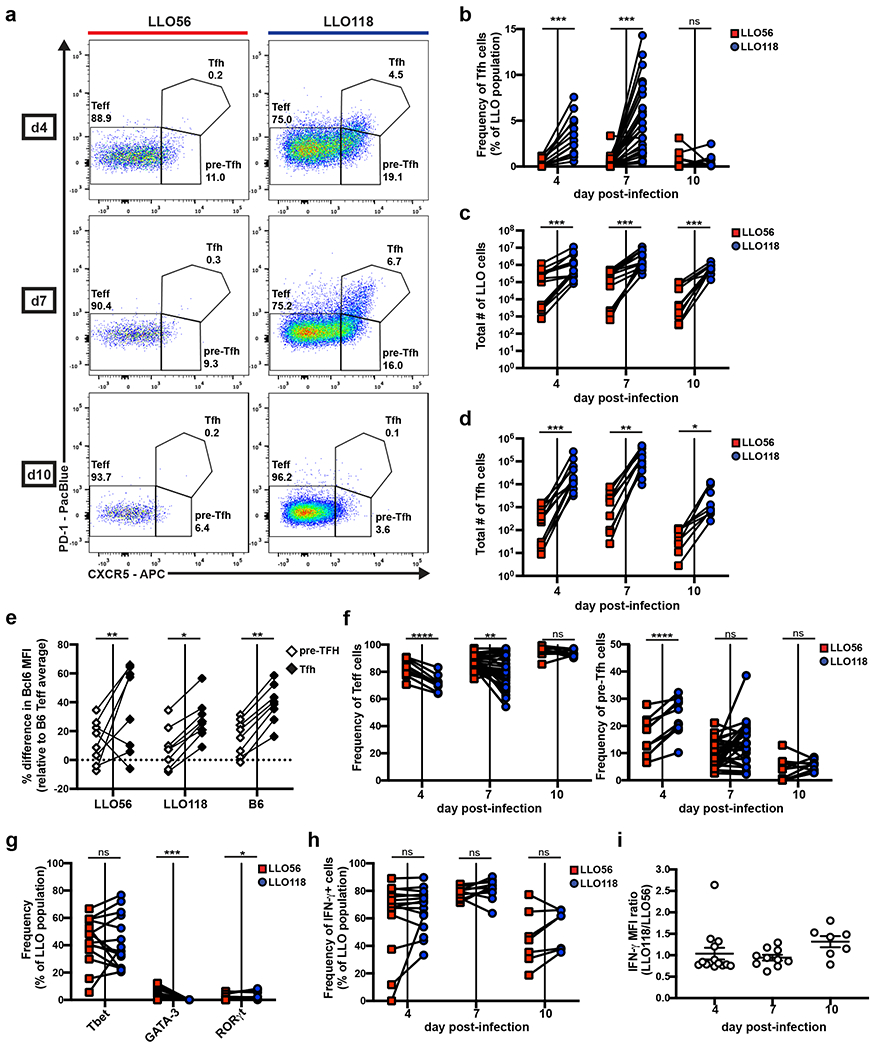
Figure 1. High and low tonic signaling cells (LLO56 and LLO118, respectively) generate equivalent Th1 immune responses, but differ in their ability to produce a Tfh population.

20,000-100,000 naive LLO56 and LLO118 cells were co-transferred into recipient B6 mice and then infected with actA-Lm the following day. Spleens were harvested on the indicated days post-infection for flow cytometry analysis of the activated LLO T cell populations (Supplemental Fig.1). Data collected from each individual recipient mouse are paired. a, Representative flow plots depicting Teff, pre-Tfh, and Tfh PD-1/CXCR5 gating strategies. Numbers shown are the frequency of each subset within the activated LLO parent population. b, Quantification of the frequency of Tfh cells. Three independent experiments for day 4 (n=13), eight for day 7 (n=31), and two for day 10 (n=10). c, Total numbers of activated LLO T cells. Three independent experiments for days 4 (n=13) and 7 (n=14), two for day 10 (n=10). d, Total numbers of LLO Tfh cells from the same experiments as in (c). e, Percentage difference in Bcl6 MFI of the paired pre-Tfh and Tfh subsets for each genotype relative to the average B6 Teff subset at day 7 post-infection. Data are from the same experiments as in (c) and exclude mice with no LLO56 Tfh generation. f, The frequency of Teff and pre-Tfh cells from the same experiments as in (b). g, LLO T cells were assessed for Tbet, GATA-3, and RORγt expression via intracellular staining at day 7 post-infection. Three independent experiments (n=14) are shown. h, Splenocytes were stimulated with PMA and ionomycin before intracellular cytokine staining was performed to assess frequency and i, MFI of IFN-γ expression in the activated LLO populations. Three independent experiments for days 4 (n=15) and 7 (n=14) and two for day 10 (n=7). MFI data shows the mean ± SEM. ****p < 0.0001, ***p < 0.001, **p < 0.01, *p < 0.05. Paired t test or Wilcoxon matched-pairs signed rank test for nonnormally distributed data (b-d, f-h). Two-way ANOVA using tukey’s multiple comparisons test for comparison of subsets across genotypes and Sidak’s multiple comparisons test for comparisons among subsets within each genotype (e). One-way ANOVA analysis (i).
