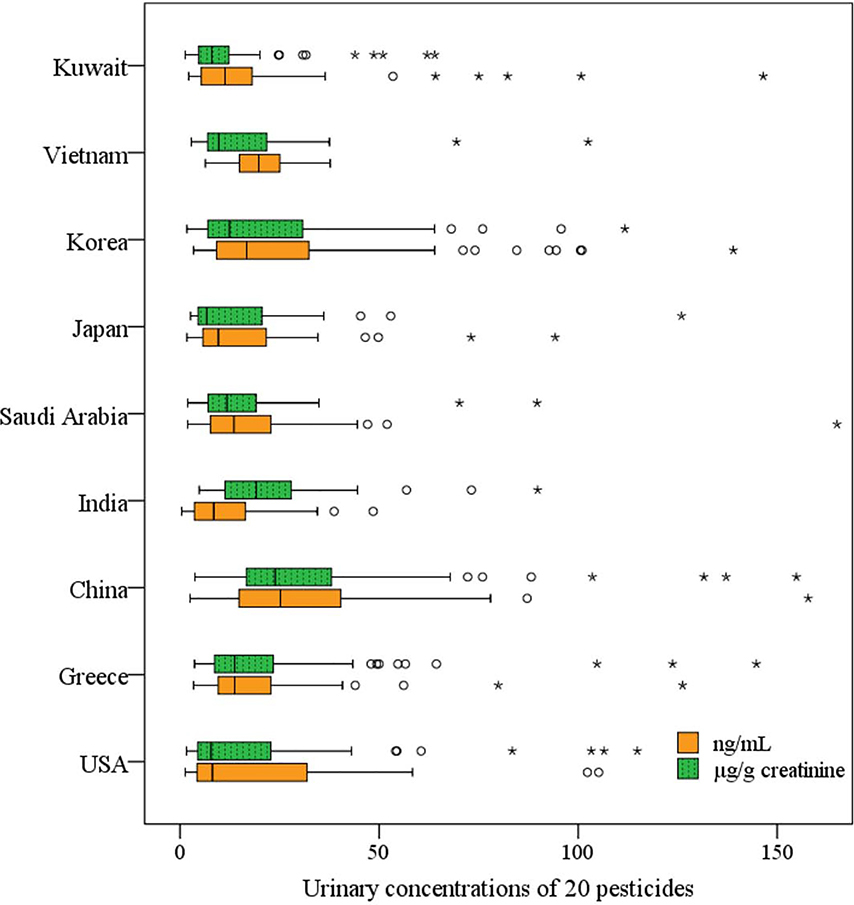
Fig. 1.
Urinary concentrations (ng/mL and μg/g creatinine) of pesticides (14 neonicotinoid insecticides and six dialkylphosphate metabolites) from nine countries. The vertical lines represent the minimum, 50th percentile, and maximum, and the boxes represent the 25th and 75th percentiles. Standard and extreme outliers are denoted by circles and stars, respectively, indicating values >1.5 and 3 times the interquartile range away from the 25th and 75th percentiles. Outliers’ concentrations of sum of 20 pesticides over 160 ng/mL and μg/g creatinine are not shown in the figure.

