
Figure. NETosis is essential for S100A8/A9-induced granulopoiesis.
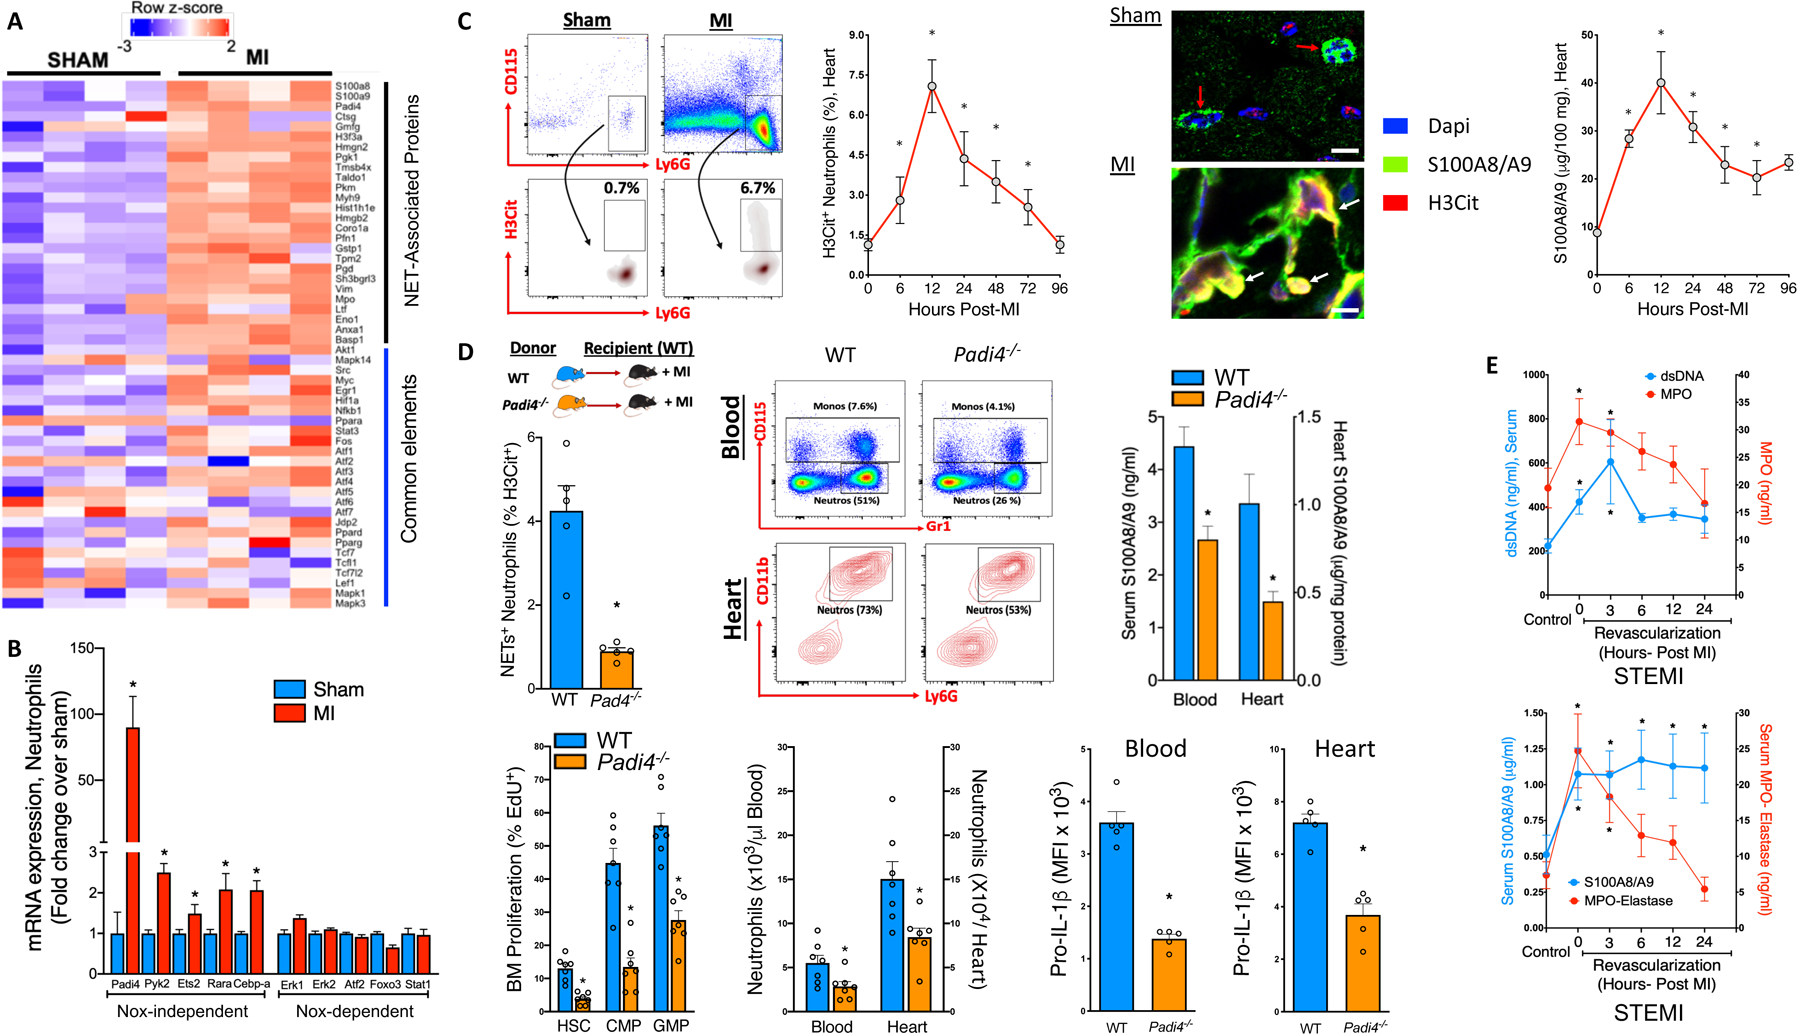
MI was induced in 8–10-week-old male C57BL/6J mice by permanent ligation of the left anterior descending (LAD) coronary artery. A) Cardiac leukocyte heat maps (RNA-seq) displaying log 2-fold change (FDR=0.025) in genes representing NET-associated proteins and elements common to both Nox-dependent and Nox-independent pathways. B) Nox-dependent and Nox-independent NETosis gene expression in cardiac neutrophils (24hr Post-MI). *P<0.05; unpaired student’s t-test (n=4). C) Representative flow cytometry plots (left panel, gated on CD45+ cells) and quantification (right panel) of NETosis in cardiac neutrophils by H3Cit staining. Confocal images (X60) of heart sections showing markers of DNA (Dapi, blue), NETosis (H3Cit, red) and S100A8/A9 (green) expression, red arrows: S100A8/A9 and DNA within the neutrophil, white arrows: externalized NETs with extensive H3Cit staining on decondensed nuclei decorated with S100A8/A9 (colocalized = orange/yellow) scale bars=10μm. Heart S100A8/A9 levels (top right) were quantified by ELISA. P<0.05 c.f. sham control (0); Kruskal-Wallis test and Dunn’s multiple comparison test. D) Experimental overview: BM from male C57BL/6J WT (blue) and Padi4−/− mice (orange) was transplanted to WT recipients and allowed to reconstitute for 6 weeks. MI was induced by LAD ligation and 18hrs later; NETosis, BM hematopoietic stem cells (HSC), common myeloid progenitor (CMP) and granulocyte macrophage progenitor (GMP) cell proliferation (EdU+), blood and heart neutrophils (with representative flow cytometry plots), along with circulating and heart neutrophil pro-IL-1β levels were measured by flow cytometry. Quantification of S100A8/A9 levels in the serum and heart (by ELISA). P<0.05 c.f. WT> WT+ MI; unpaired t-test. E) Quantification of dsDNA (blue line) and myeloperoxidase (MPO, red line), and S100A8/A9 (blue line) and MPO-Elastase (red line) in the serum from control (non-STEMI) and STEMI patients on admission (0) and 3, 6, 12 and 24hrs post-revascularization by PCI. n=15–21/group, *P<0.05 c.f. healthy control group; Mann-Whitney test.