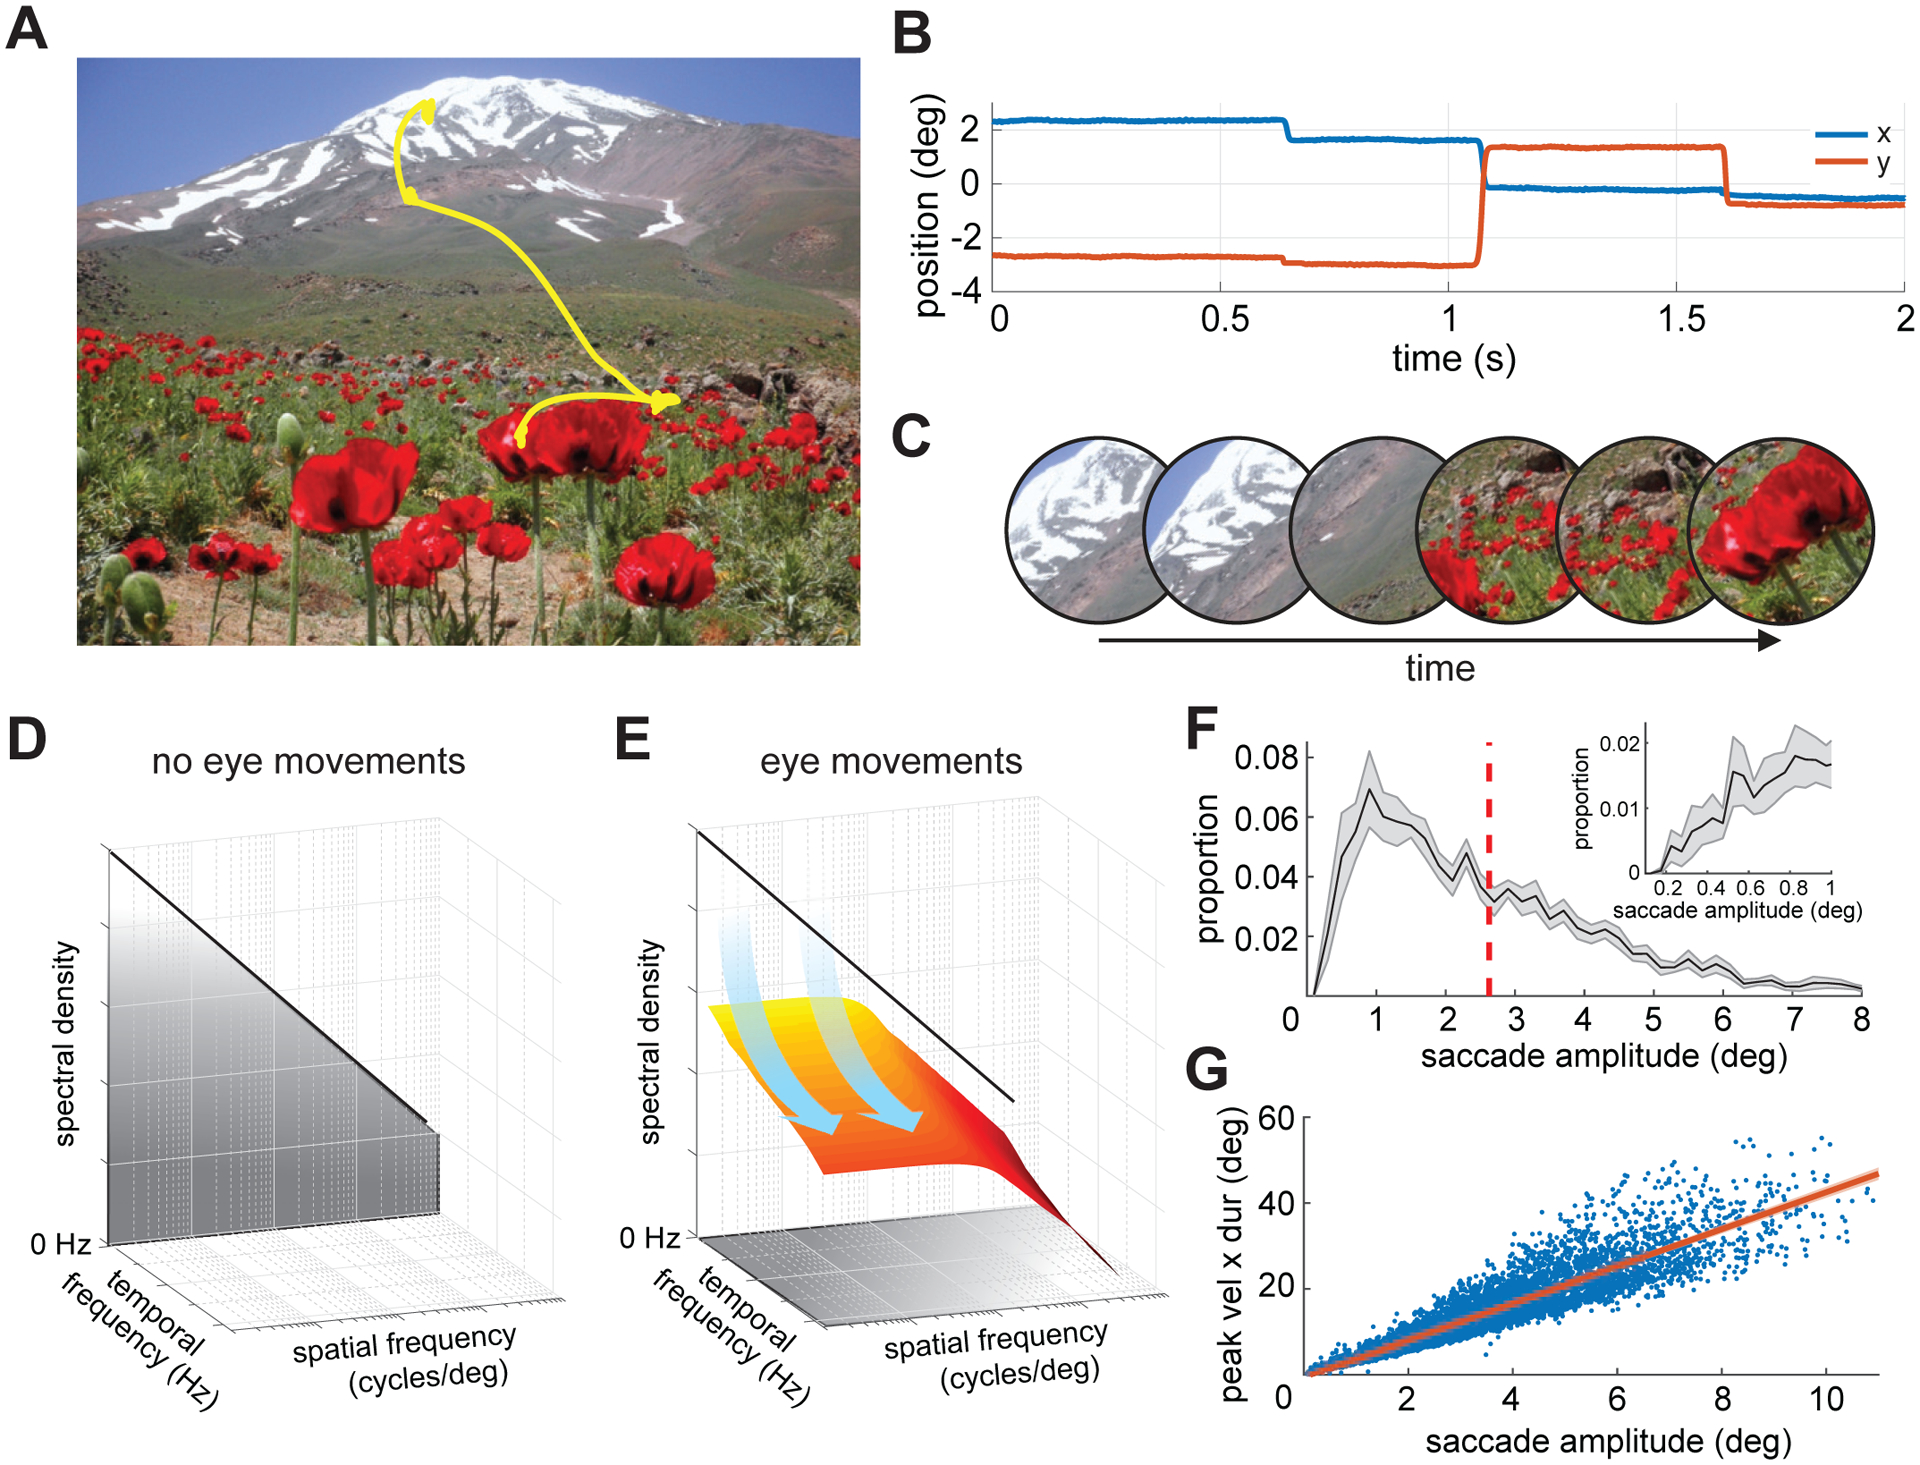
Figure 1. Oculomotor influences on the retinal input.

Observers freely examined pictures of natural scenes, while their eye movements were measured at high spatial and temporal resolution.
(A) An example of recorded eye movements superimposed on the observed image.
(B) The corresponding horizontal and vertical traces of eye positions as a function of time.
(C) Eye movements transform a static visual scene into a time-varying luminance flow on the retina. An example of the resulting visual flow: the images represent the input at various times as the eye moves.
(D-E) This transformation corresponds to a redistribution of the stimulus spatial power in the joint space-time frequency domain. The power of the retinal stimulus would (D) be concentrated at 0 Hz in the absence of image motion, but (E) is shifted to nonzero temporal frequencies by eye movements.
(F-G) Saccade characteristics. (F) Distribution of saccade amplitude averaged across observers (N = 14; bin width 0.2°). The vertical dashed line marks the mean of the distribution. The inset zooms in on the range of small amplitudes (bin width 3′). (G) Saccade main sequence. Each dot corresponds to one saccade, and the red line represents the linear regression of the data averaged across subjects. Shaded areas in both F and G represent SEMs across subjects.
