
Figure 2. Power redistribution caused by saccades.
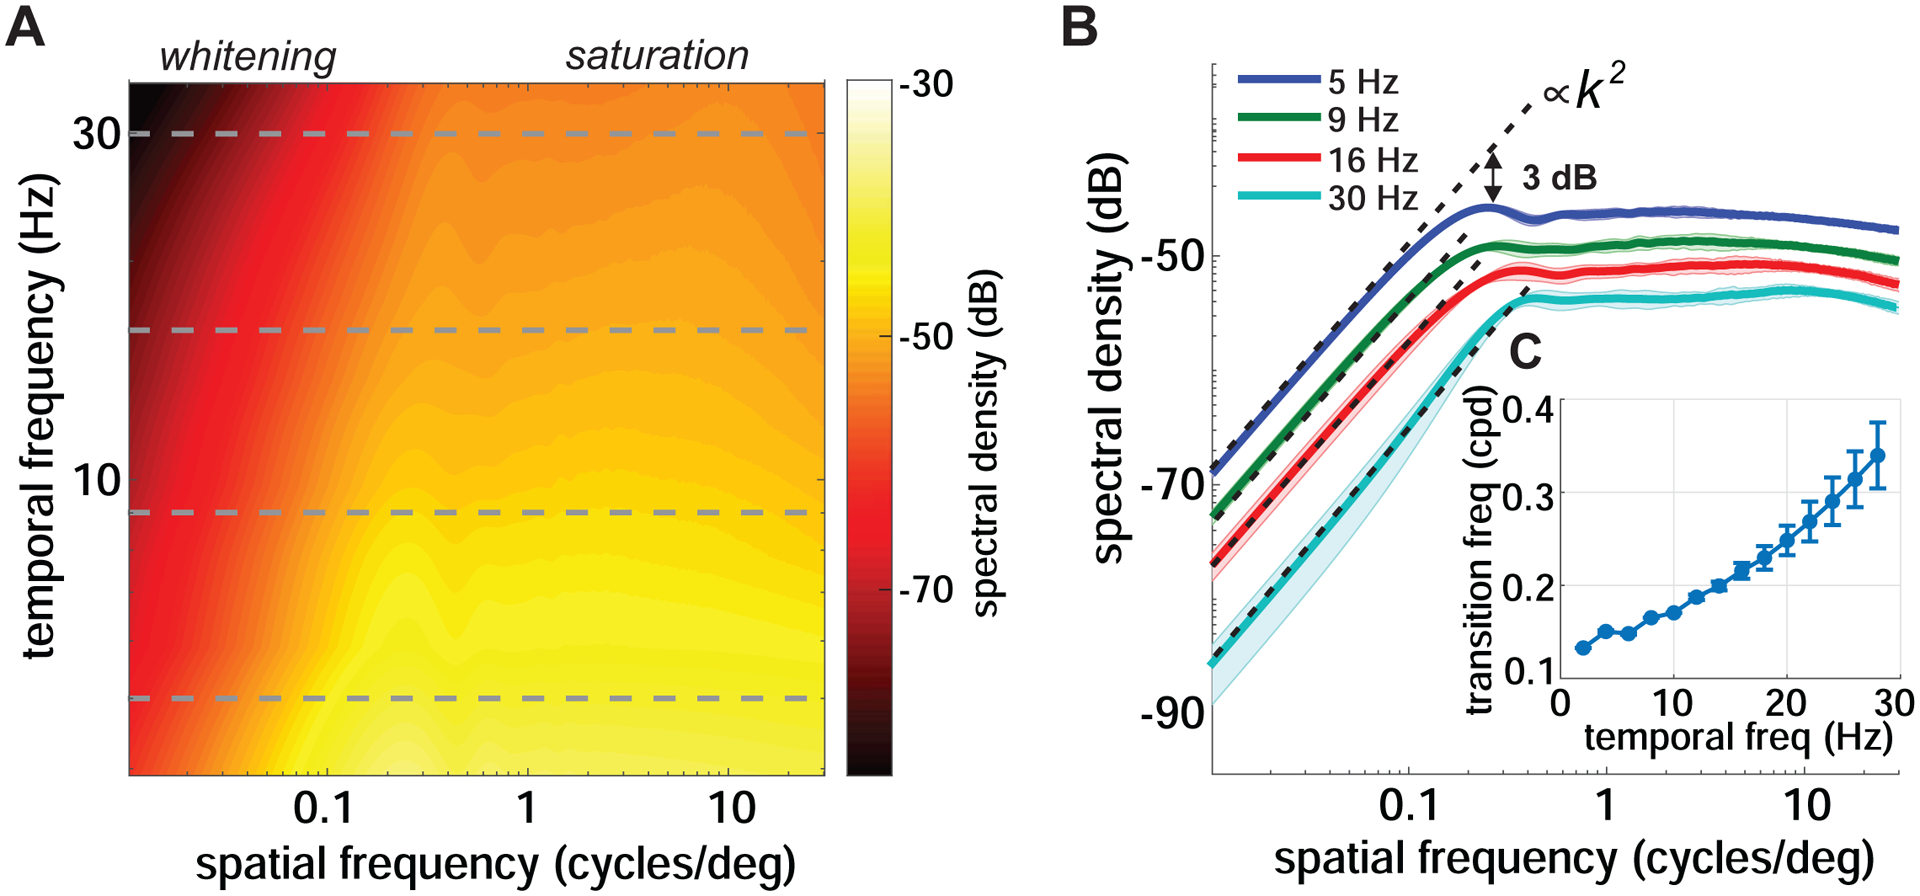
(A) Proportion of the spatial power in the stimulus that saccades make available at each spatial and temporal frequency on the retina. Data represent averages across observers and refer to saccades with 2 – 3° amplitudes. Note the presence of two distinct regimes. The horizontal dashed lines mark the temporal frequencies further examined in B.
(B) Power present at four temporal frequencies (dashed lines in A). For each temporal frequency, the critical spatial frequency separating the two regimes is defined as the frequency at which power deviates by 3 dB from the k2 interpolation (k denotes spatial frequency).
(C) The critical spatial frequency as a function of temporal frequency. Shaded areas in B and error bars in C represent one SD across subjects.
See also Figure S1.