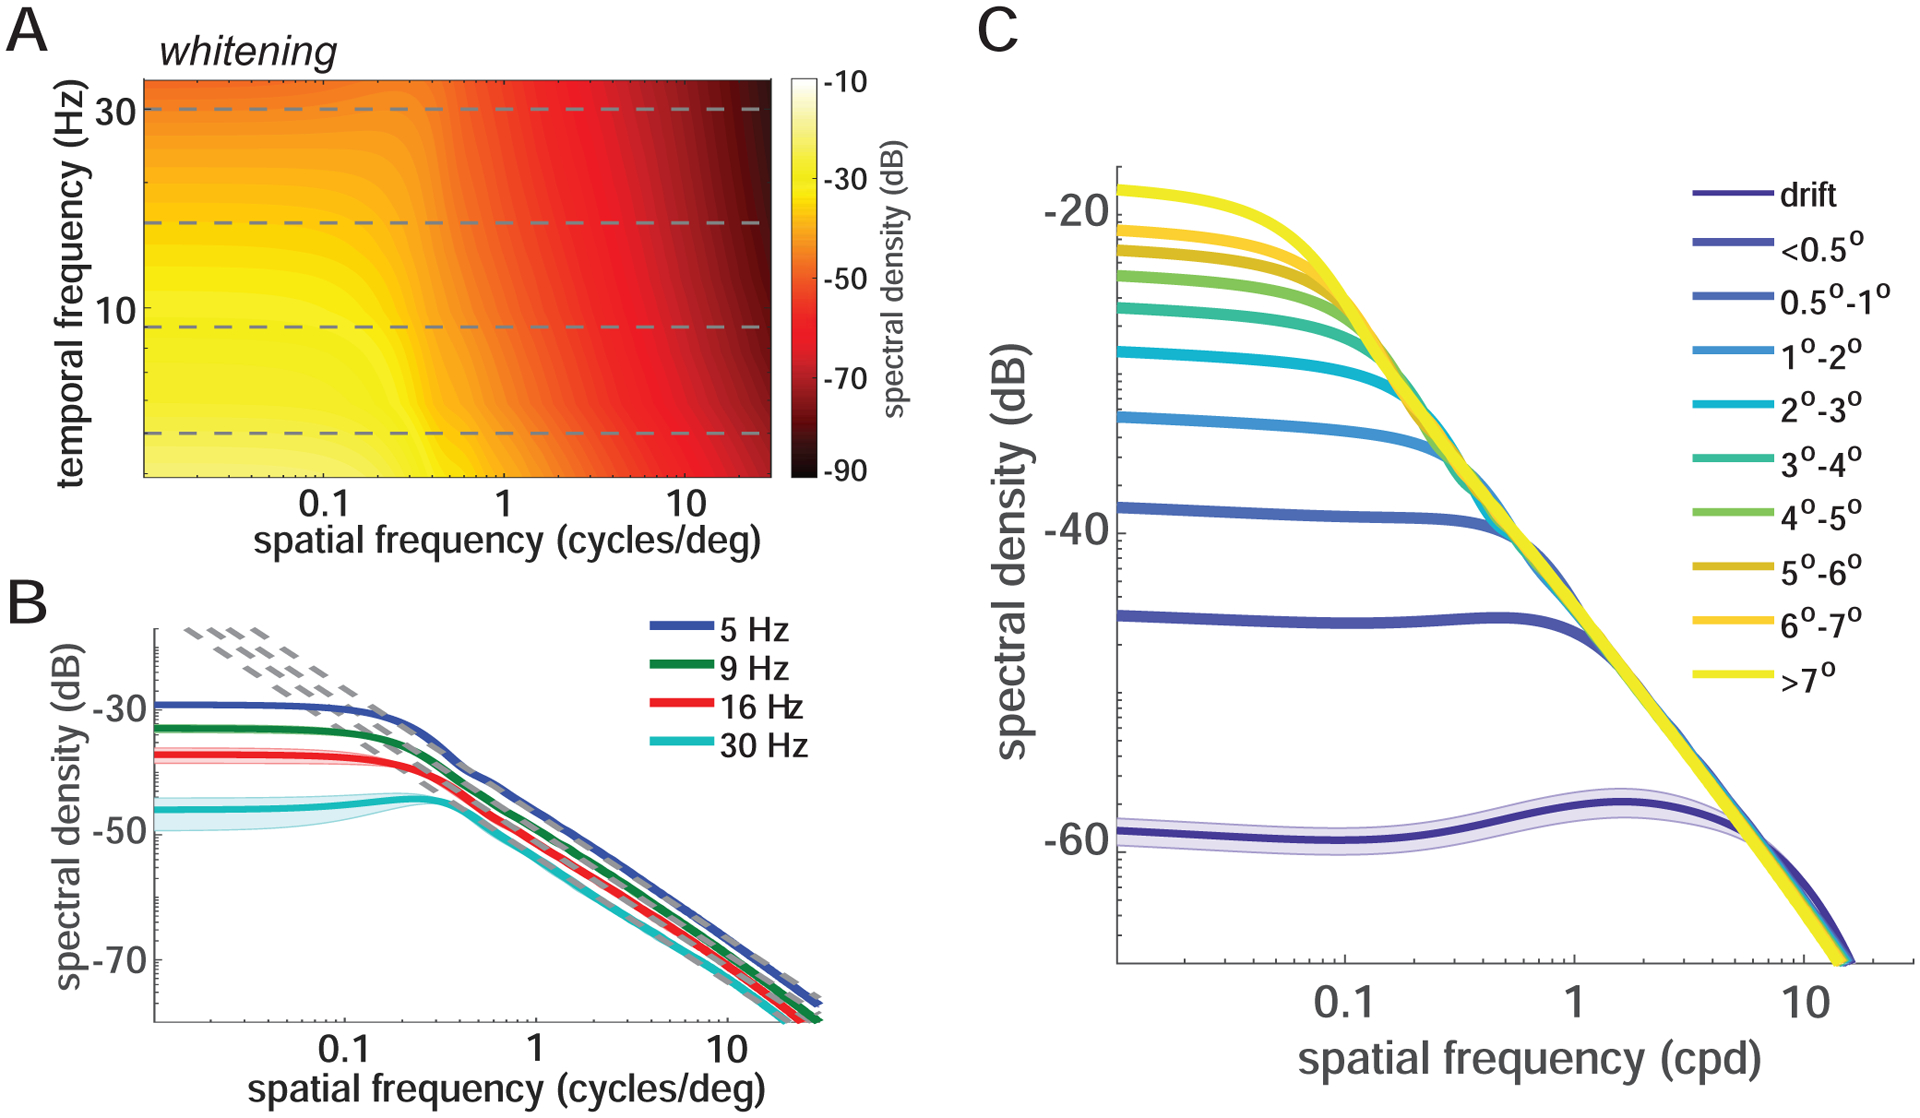
Figure 4. Interaction between the power redistribution due to saccades and natural scenes.

(A-B) Power spectrum of the luminance modulations from saccades (2°−3°) during viewing of natural images. Both the full space-time distribution (A) and sections (B) at selected temporal frequencies (horizontal lines in A) are shown. Note that below the critical spatial frequency saccades counterbalance the power spectrum of natural scenes. At higher spatial frequencies, visual signals follow the spectral density of natural images (the dashed lines, k−2, in B). Graphical conventions are as in Figure 2.
(C) Power in the temporal range of human sensitivity delivered by saccades with various amplitudes. The shaded areas represent SEM.
