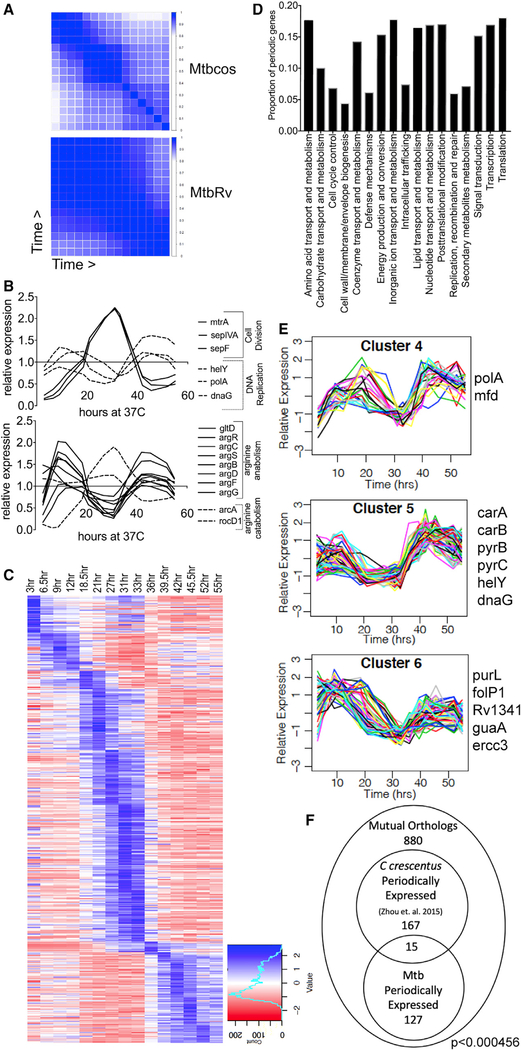
Figure 2. Periodic Gene Expression Correlates with Cell Cycle Progression.
(A) Correlation matrix of DESeq2 normalized counts for single replicates of Mtbcos (top) and MtbRv (bottom) for all 16 time points (blue, Pearson’s correlation coefficient = 1; white, Pearson’s correlation coefficient = 0).
(B) Relative expression (GP smoothed, DESeq2 normalized read count for each time point divided by the mean value for that gene across time) of genes involved in DNA replication and cell division (top panel); arginine catabolism and anabolism (bottom panel).
(C) Relative expression (standard normalized DESeq2 counts—each value is subtracted by the mean for that gene across time and then divided by the standard deviation) of 485 periodically expressed genes in Mtbcos (rows) sorted by peak expression time (columns).
(D) Fraction of periodically expressed genes present in different Gene Ontology categories.
(E) Clusters containing periodic genes with expression patterns consistent with a role in DNA replication. Known DNA replication and/or nucleotide biogenesis genes found in these clusters are listed.
(F) Overlap between periodically expressed Mtbcos and C. crescentus mutual orthologs. p value indicates significant overlap between the two gene sets determined by using a hypergeometric test.
See also Figures S1 and S2, Tables S1 and S2, and Data S1, S2, and S3.

