Fig. 1.
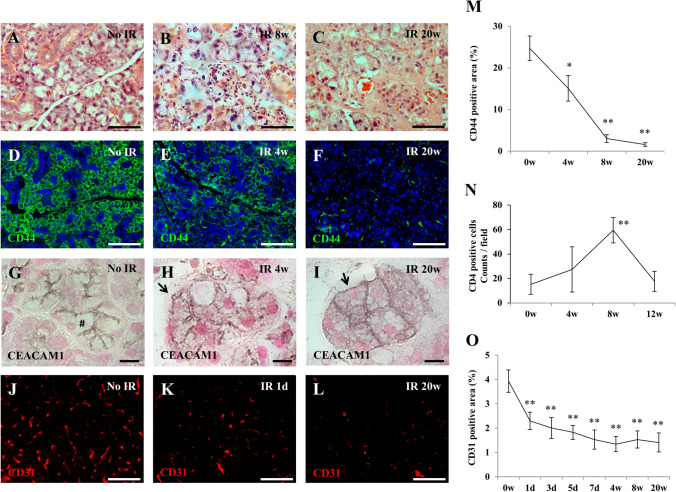
Histologic analysis of submandibular gland after IR. a–c Hematoxylin and eosin staining of non-irradiated submandibular glands (A), and SGs at 8-weeks (b), and at 20-weeks (c) after IR. Scale bar; 50 µm. d–f Immunofluorescence analyses of non-irradiated SGs (d), and SGs at 4-weeks (e), and at 20-weeks (f) after IR using antibodies targeted against CD44 (Green). Scale bar; 100 µm. Blue; DAPI, Green; CD44. g–i Paraffin-sections of submandibular glands with no IR (g), at 4-weeks (h), and at 20-weeks (i) after IR were stained for carcinoembryonic antigen-related cell adhesion molecule 1 (CEACAM1). Sections were counterstained with hematoxylin. CEACAM1 expression was observed only luminal (#) of acinar with no IR (g). In contrast, it was detectable at the whole acinar cell membrane, not luminal but also basal (arrow), at 4-weeks (h) and at 20-weeks (i) after IR. Scale bar; 10 µm. j–l Immunofluorescence staining for CD31 (Red) of submandibular glands with no IR (j), at 1-day (k), and 20-weeks (l) after IR. Scale bar; 50 µm. Red; CD31. m Changes of CD44-positive area (%) of salivary glands at 4-, 8-, and 20-weeks after IR. Asterisk represents statistical significance compared with no irradiated submandibular glands (**p < 0.01, *p < 0.05). n Changes of the number of CD4 positive cells at 4-, 8- and 12- weeks after IR. Asterisk represents statistical significance compared with no irradiated submandibular glands (**p < 0.01). o Changes of blood vessel area (%) in parenchyma of submandibular glands at 1-, 3-, 5-, 7-days, 4-, 8-, 12-, and 20-weeks after IR. Asterisk represents statistical significance compared with no irradiated submandibular glands (**p < 0.01)

