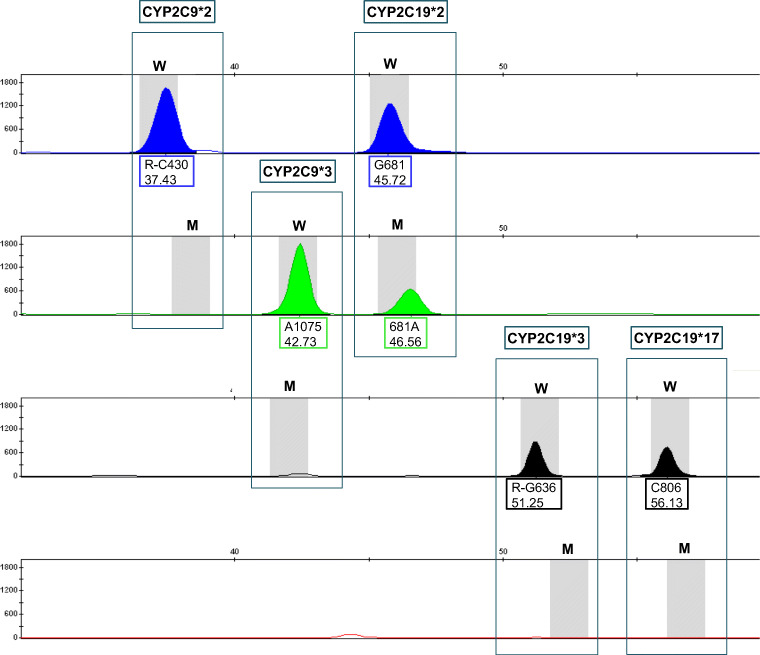
Fig. 2.
Electropherogram of SNaPshot products of a multiplex reaction. The horizontal scale shows fragment length in nucleotides (nt). The vertical scale shows signal intensities in relative fluorescence units (RFU). Results are shown in four color channels. The five boxes contain the five polymorphic DNA sites investigated with the two possible characteristics (gray bars; W = wild type, M = mutation). Signals indicate the detected alleles. The upper number in the labeling box of each signal corresponds to the position in the gene, with the letter before the number representing the base of the wild type and the letter after the number the base of the mutation. The lower number corresponds to the measured fragment length in nucleotides

