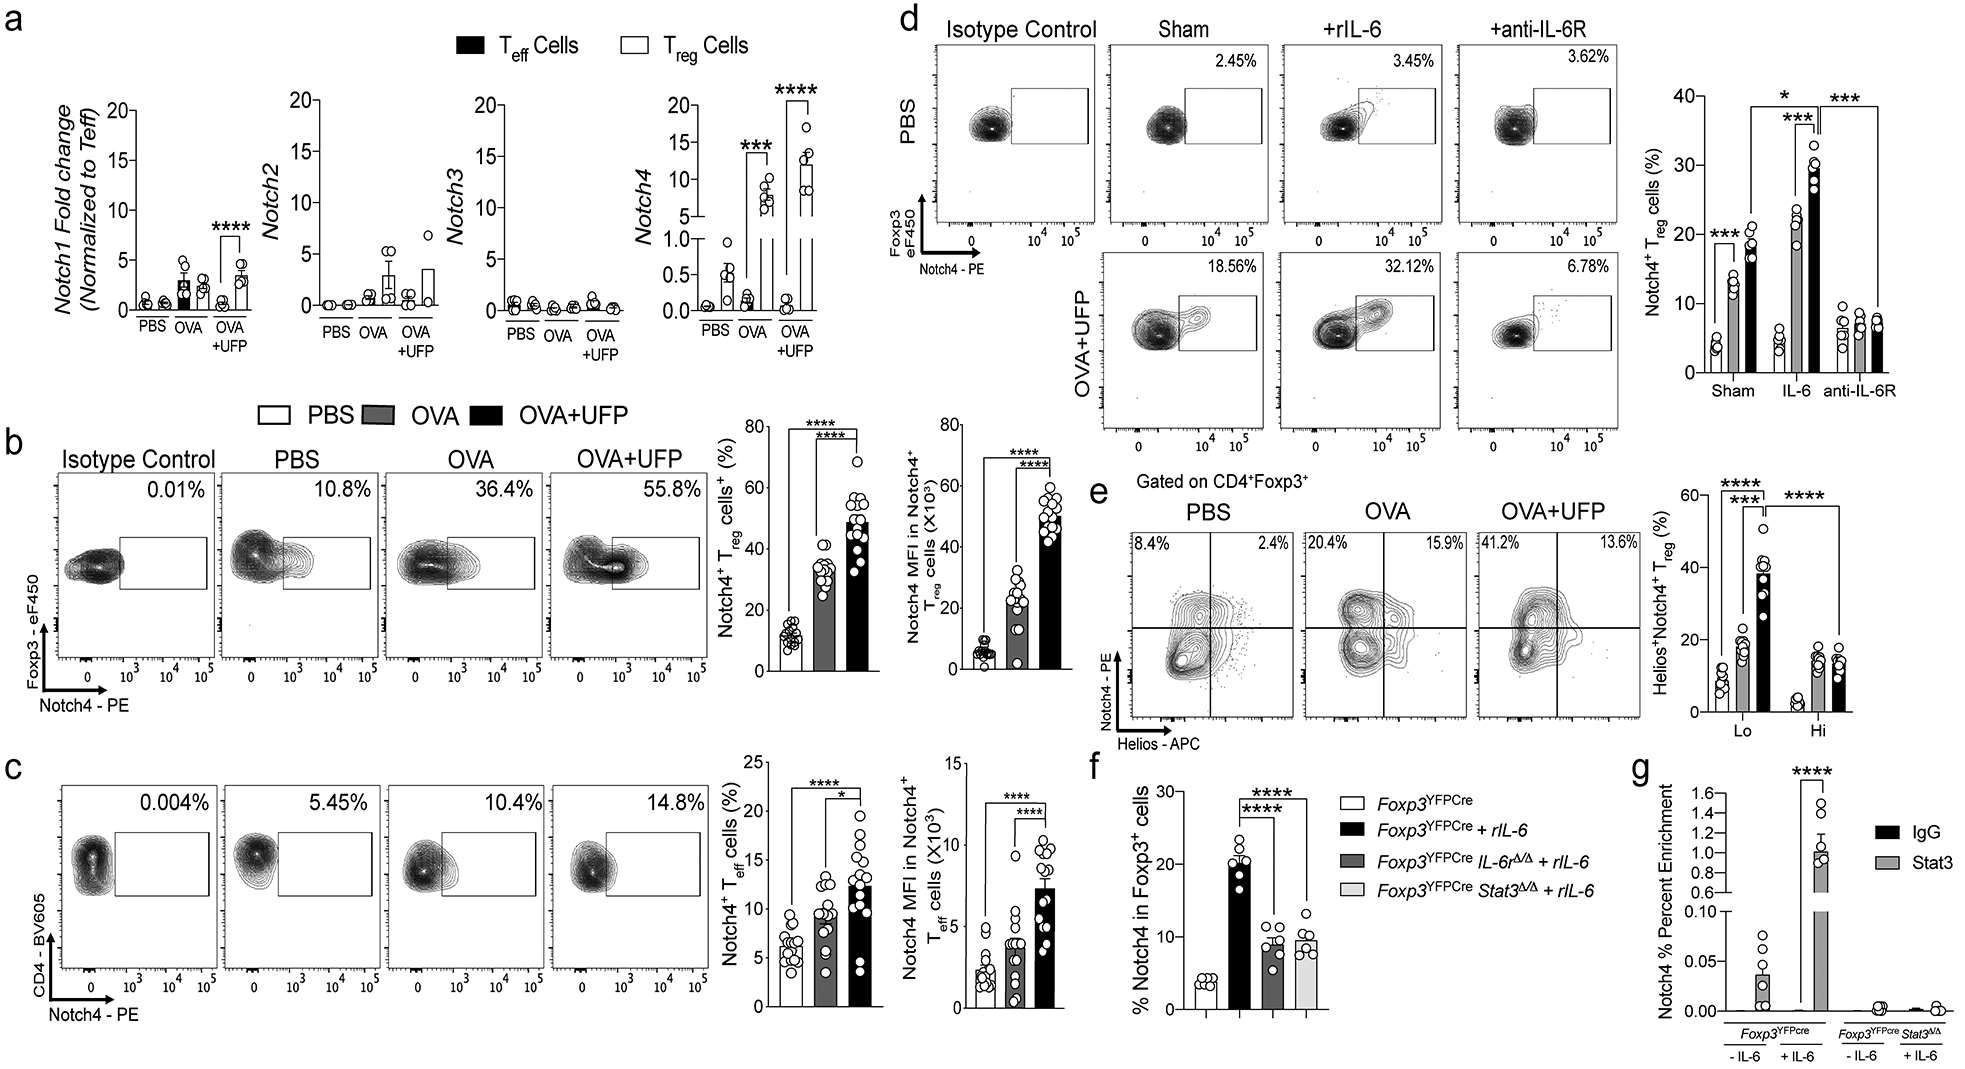
Fig. 1. Notch4 expression on lung Treg cells in allergic airway inflammation.

a, RT-PCR of Notch1-4 transcripts in lung Treg and Teff cells isolated from PBS, OVA and OVA+UFP mouse groups (n=5). b,c, Flow cytometric analysis, cell frequencies and mean fluorescence intensity (MFI) of Notch4 expression on lung Treg and Teff cells in the respective treated groups (n=15). d, Flow cytometric analysis and cell frequencies of Notch4 expression on OT-II+CD4+Foxp3+ T cells generated in co-cultures with sham or OVA323–339+UFP-pulsed alveolar macrophages without or with IL-6 or anti-IL-6R mAb (n=5). e, Flow cytometric analysis and cell frequencies of Notch4+Helios– and Helios+ lung Treg cells isolated from the respective treated groups (n=5). f, Flow cytometric analysis and cell frequencies of Notch4 expression on in vitro differentiated Treg cells derived from naive CD4+ T cells isolated from Foxp3YFPCre, Foxp3YFPCreIl6rΔ/Δ and Foxp3YFPCreStat3Δ/Δ mice and either untreated or treated with IL-6 (n=6). g, ChIP assays for the binding of STAT3 and control (IgG) antibodies to the Notch4 promoter in lung Treg cells of OVA+UFP-treated Foxp3YFPCre, and Foxp3YFPCreStat3Δ/Δ mice (n=6). Each symbol represents one mouse. Numbers in flow plots indicate percentages. Error bars indicate SEM. Statistical tests: One-way ANOVA with Dunnett’s post hoc analysis (b,c,f); two-way ANOVA with Sidak’s post hoc analysis (a,d,e,g). *P<0.05, ***P<0.001, ****P<0.0001. Data representative of two or three independent experiments.
