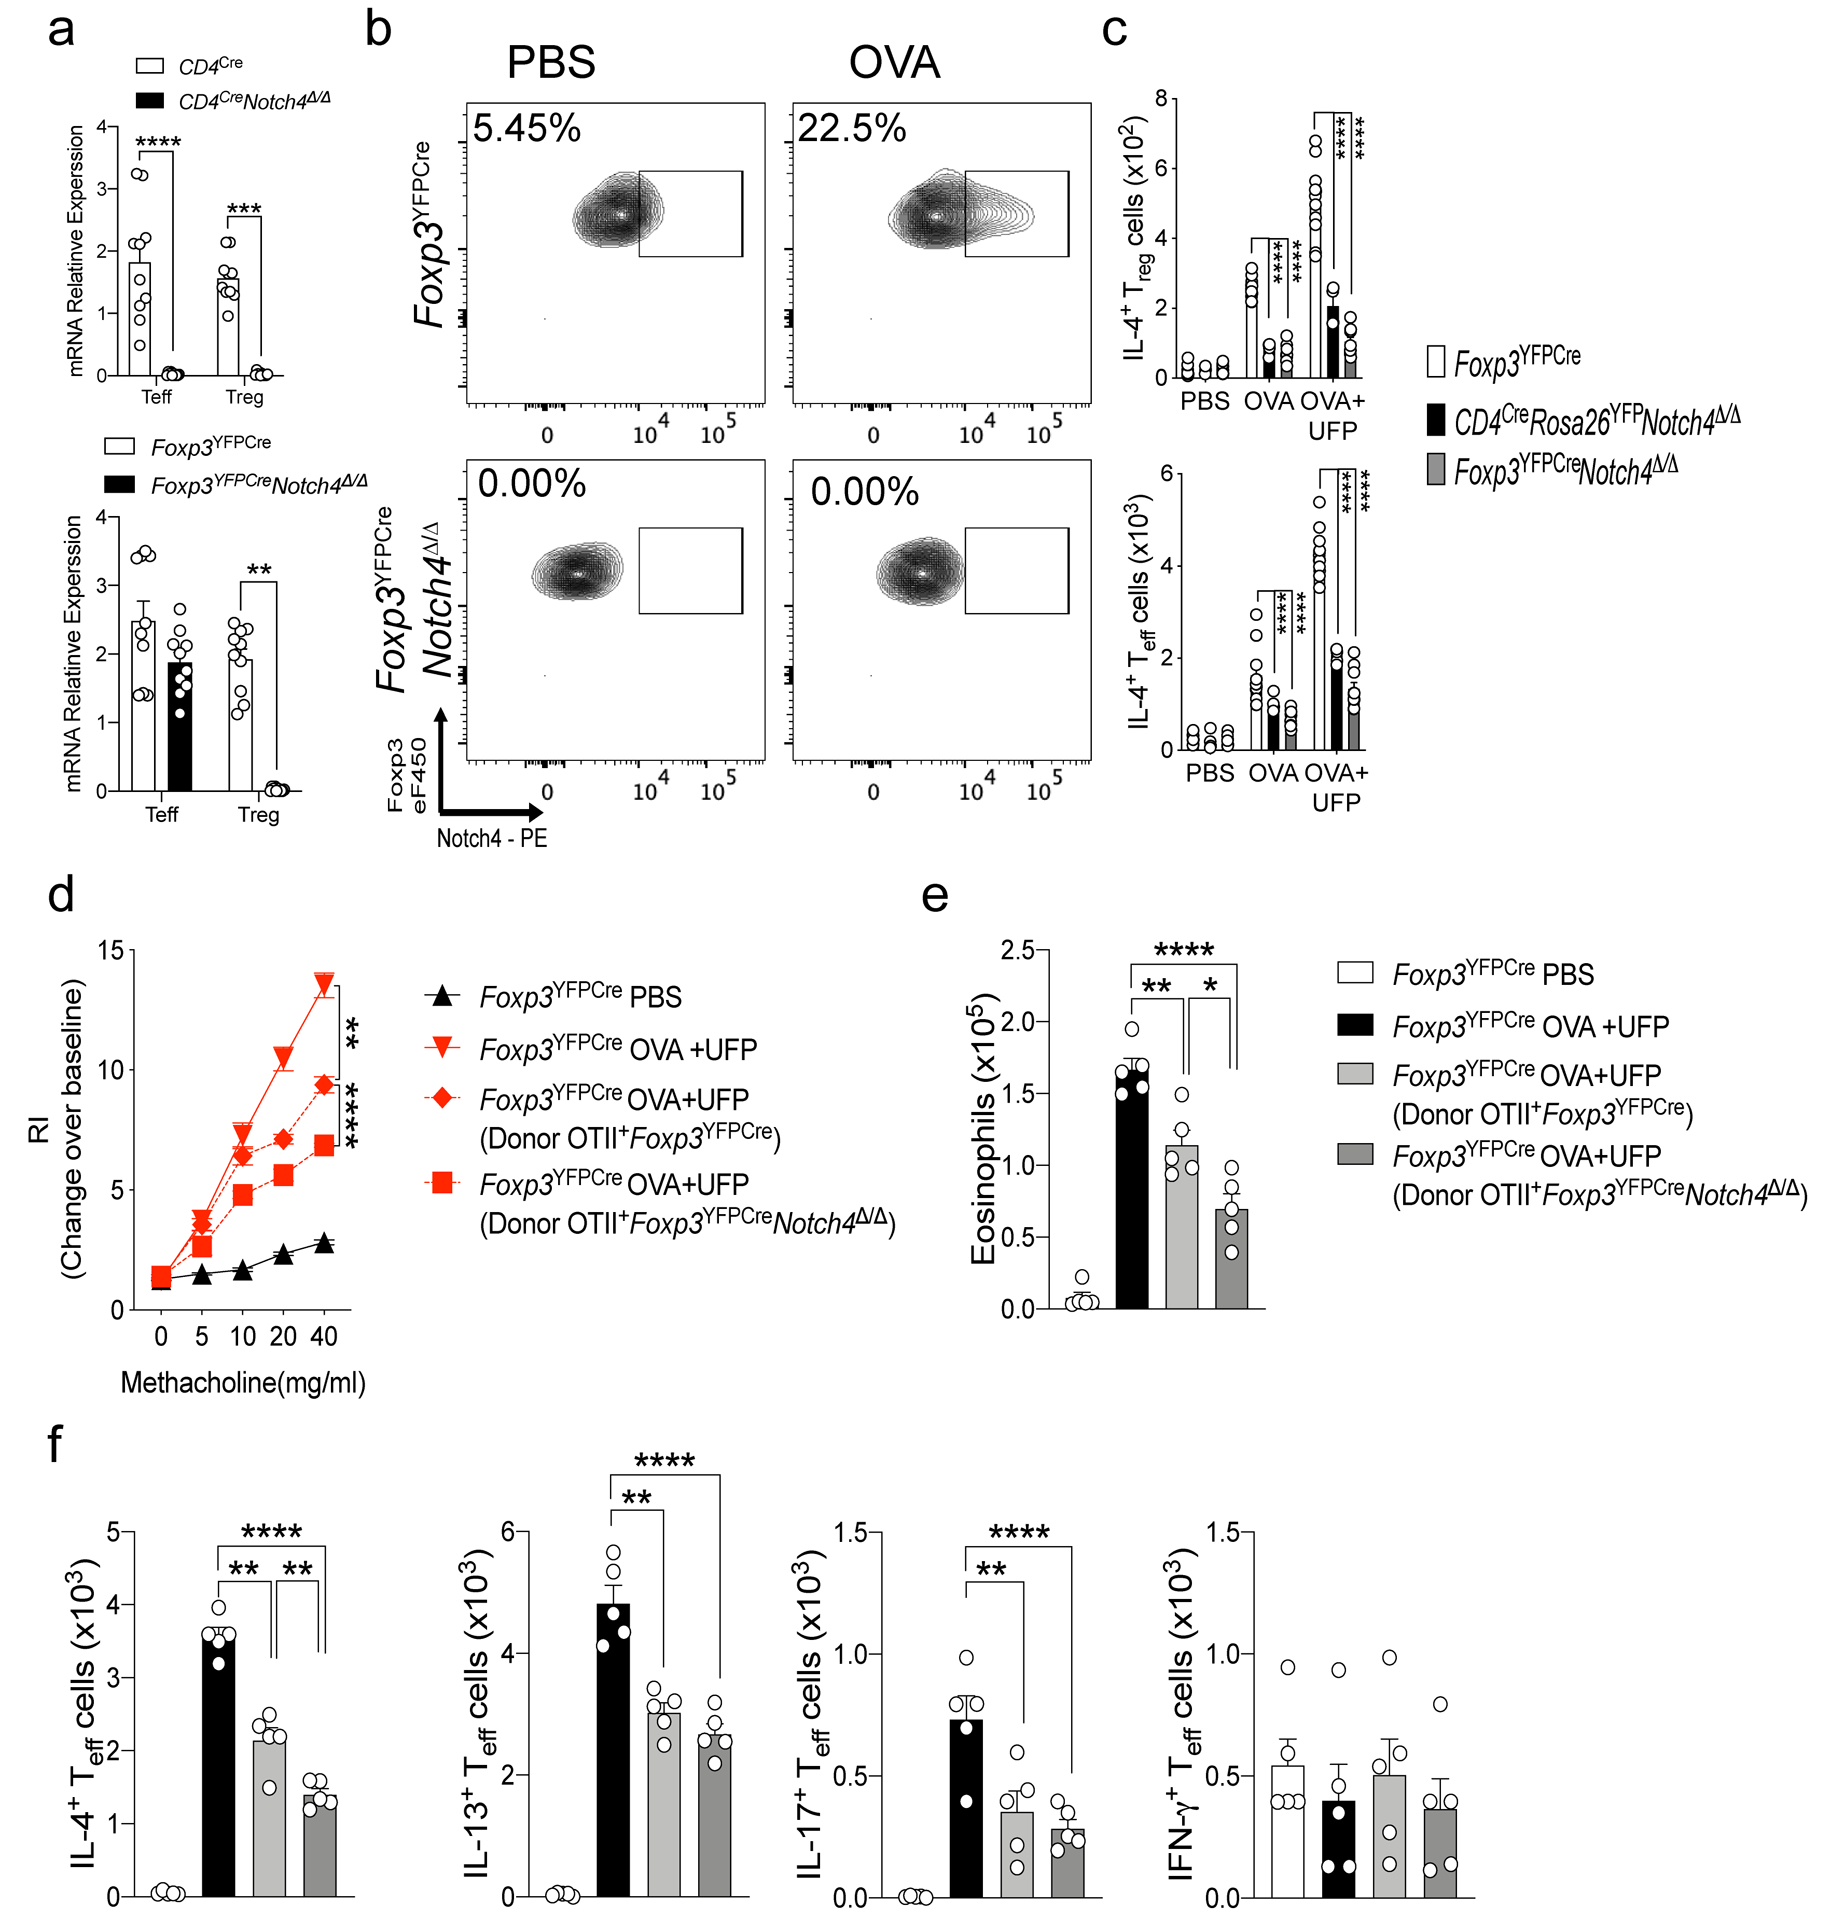
Extended Data Fig. 2. Notch4 expression on lung Treg cells licenses allergic airway inflammation.

a, RT-PCR analysis of Notch4 expression in CD4Cre mice in B-cells and T-cells (n=5). b, RT-PCR analysis of Notch4 expression in Foxp3YFPCre mice in both Treg and Teff cells (n=5). c,d, IL-4 and IFN-γ expression in lung Foxp3+CD4+ Treg. (c) and Foxp3–CD4+Teff cells. (d) derived from the respectively treated Foxp3YFPCre, CD4CreNotch4Δ/Δ and Foxp3YFPCreNotch4Δ/Δ mice (n=5). e, Airway hyperresponsiveness in Foxp3YFPCre sensitized either with PBS or OVA, then challenged with OVA+UFP following transfer of OTII+Foxp3YFPCre or OTII+Foxp3YFPCreNotch4Δ/Δ iTreg cells (n=5). f, Eosinophil numbers for the respective mouse groups (n=5). g, IL-4, IL-13, IL-17 and IFNγ expression in lung Foxp3–CD4– Teff cells. Each symbol represents one mouse (n=5). Error bars indicate SEM. Statistical tests: two-way ANOVA with Sidak’s post hoc analysis (a,c,d); One-way ANOVA with Dunnett’s post hoc analysis (e,f). *P<0.05, **P<0.01, ***P<0.001, ****P<0.0001. Data representative of two or three independent experiments.
