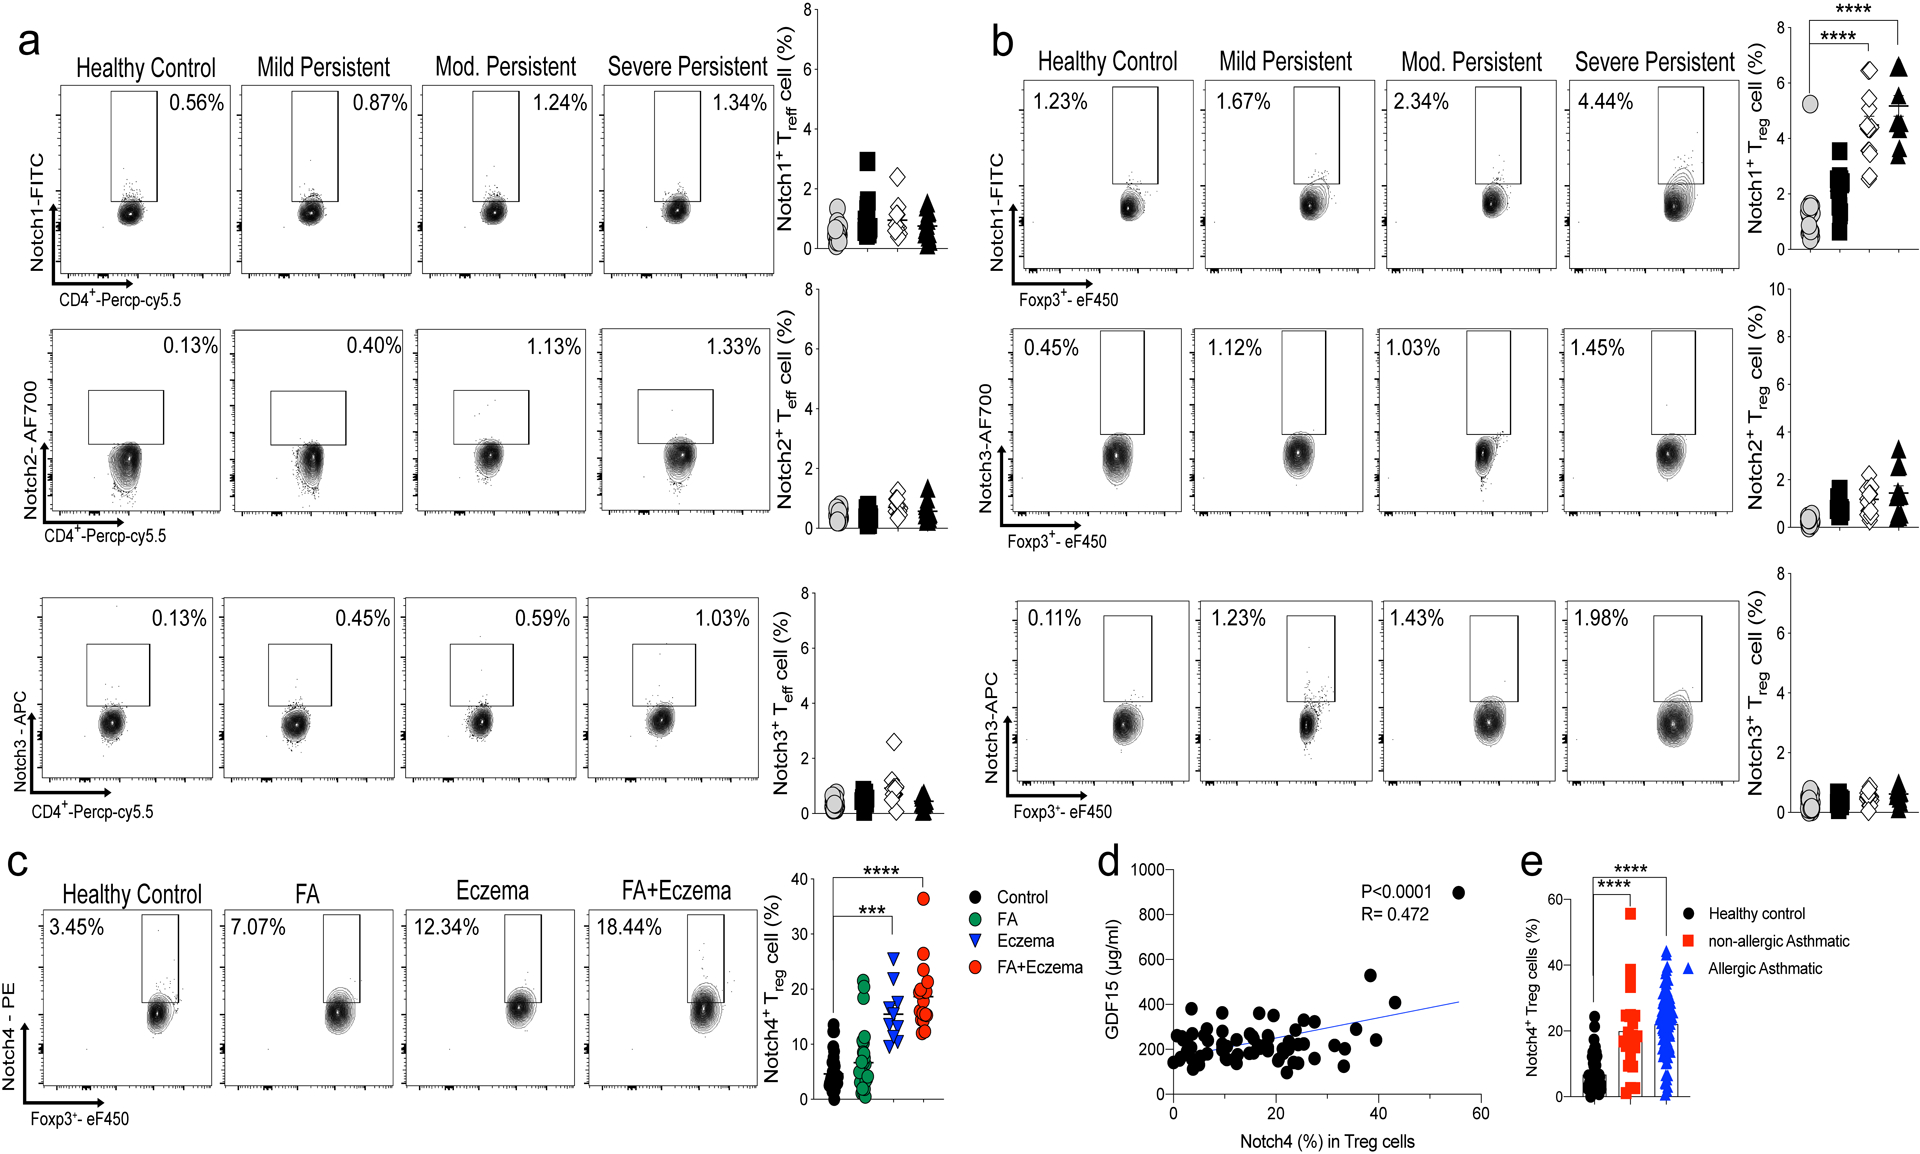
Extended Data Fig. 8. Notch receptor expression in human Treg and Teff cells.

a,b, Flow cytometric analysis, cell frequencies and mean fluorescence intensity (MFI) of Notch1, 2 and 3 expression in peripheral blood Treg cells (a) and Teff cells (b) of control and asthmatic subjects, the latter segregated for asthma severity (control n=22, M.P n= 15, Mod n= 16. S.P n=11). c, Flow cytometric analysis and cell frequencies of Notch4 peripheral blood Treg cells of healthy control, food allergy (FA), eczema and FA+eczema (Control n=37, FA n= 28, Eczema n=10 and FA+Eczema n=20) d, Serum GDF15 concentrations in asthmatic subjects plotted as a function of Notch4 expression on circulating Treg cells (n=73) e, Cell frequencies of Notch4 expression in peripheral blood Treg cells in healthy subjects, allergic and non-allergic asthmatics (control = 56, non-allergic n=21, allergic n=85). Error bars indicate SEM. Statistical tests: One-way ANOVA with Dunnett’s post hoc analysis. (a-c,e); simple regression analysis (d). ***P<0.001, ****P<0.0001. Data representative of two or three independent experiments.
