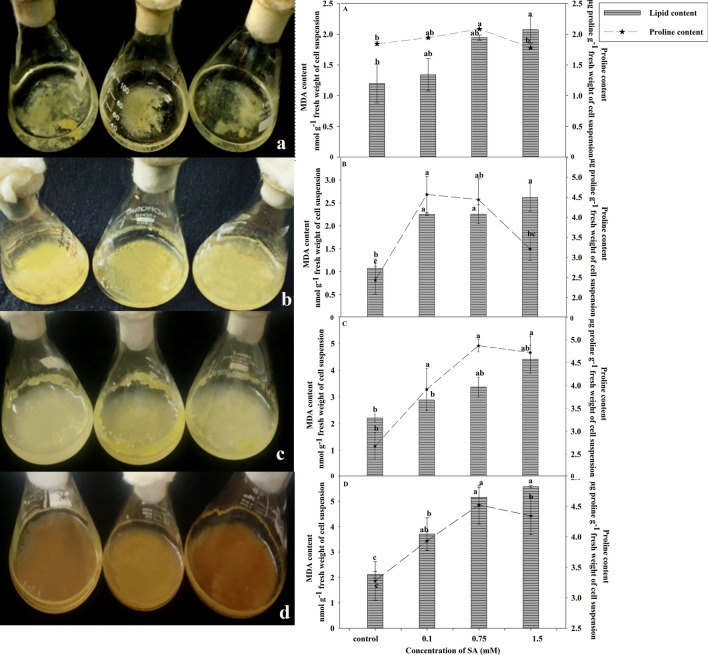
Fig. 3.
MDA and proline content in cell suspension cultures of A. graveolens. The cell cultures were elicited with 0.1, 0.75 and 1.5 mM SA for a period of 4 weeks a Lag phase b; c exponential growth phase (second and third week) d declining phase (after fourth week) of SA elicitation. Control represents non treated cell line. Vertical bar and horizontal line represents mean ± standard error (n = 3) and were analyzed by one way ANOVA. The values are significant at 0.01 level

