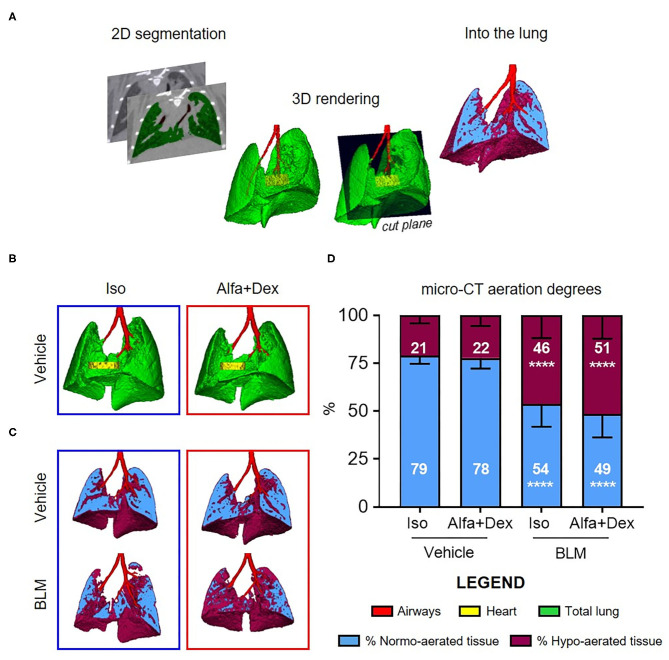
Figure 1.
Micro-CT imaging to compare gas and injectable anesthesia protocols. (A) A schematic diagram of micro-CT images processing. (B) Representative 3D lung renderings of vehicle mice anesthetized alternatively with Isoflurane (blue box) or Alfa+Dex (red box) at day 21 after the first oral aspiration procedure. Airways, heart and total lung are colored in red, yellow, and green, respectively. Some representative cutting planes for vehicle and BLM mice showing the distribution of normo- and hypo-aerated compartments within each slice (C) and their quantification on total lung volumes (D). Results are expressed as mean ± SD and changes in BLM groups were compared to vehicle using 2-way ANOVA followed by Sidak's test for multiple comparison; ****p < 0.0001.

