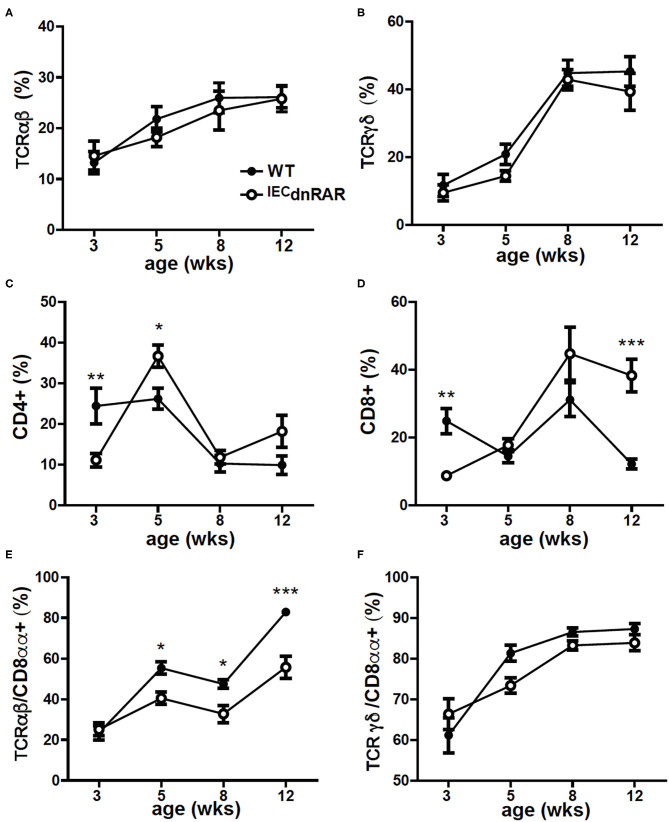
Figure 2.
Reduced frequencies of CD8αα+ T cells in the SI of A+ IECdnRAR mice. The A+ WT and A+ IECdnRAR frequencies of (A) TCRαβ+, (B) TCRγδ+, (C) CD4+, (D) CD8+, (E) TCRαβ+/CD8αα+, and (F) TCRγδ+/CD8αα+ T cells in the SI IEL. Values are the mean ± SEM of two combined experiments with n = 7–11 mice at each time point. Two-way ANOVA with Bonferroni post-test, *P < 0.05, **P < 0.01, ***P < 0.001.

