FIGURE 2.
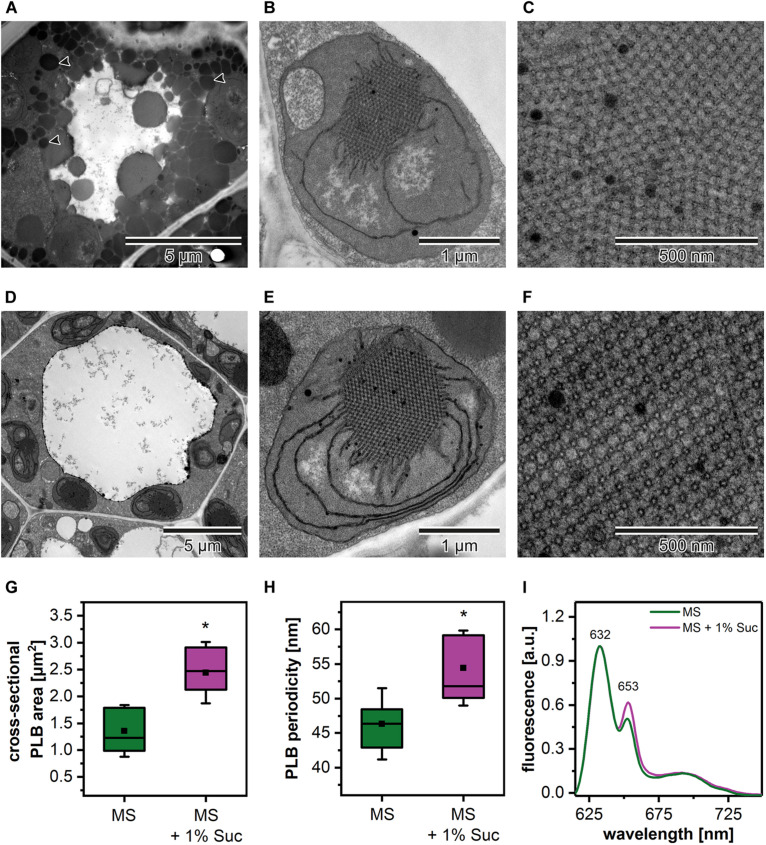
Cotyledon ultrastructure of 5-day etiolated Arabidopsis (Col-0) seedlings grown on Murashige and Skoog (MS) medium without (A–C) and with sucrose (1% Suc) supplementation (D–F); electron micrographs showing whole cell (black arrowhead – lipid body) (A,D), etioplast ultrastructure (B,E), and prolamellar body (PLB) nano-morphology (C,F). Measurements of the PLB structural parameters (G,H); the horizontal line and black square in each box represent the median and mean value of the distribution, respectively; the bottom and top of each box represent 25 and 75 percentile; whiskers denotes standard deviation (SD); results from MS + 1% Suc samples marked with asterisk differ significantly at p = 0.05 from MS samples. Representative low-temperature (77 K) fluorescence emission spectra (excitation at 440 nm) of cotyledons and upper ∼ 2 mm of hypocotyl (I); all spectra were normalized to the maximal value.

